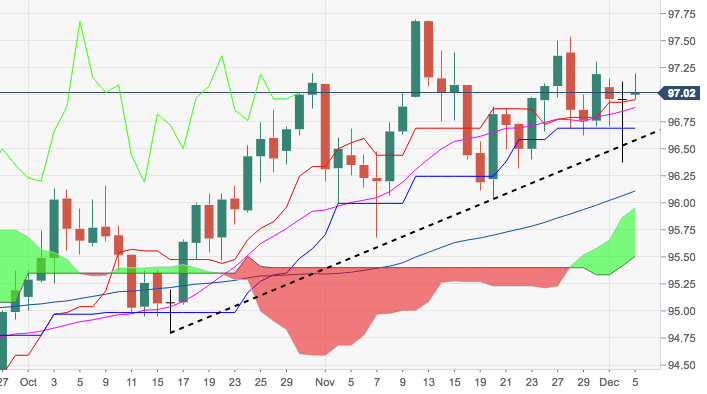
- Following yesterday’s deep pullback and test of the key support line, the index managed to rebound and retake the critical barrier at 97.00 the figure.
- Despite the bounce, the greenback stays somewhat vulnerable and another visit of the 96.00 neighbourhood is not ruled out in the near term. In this area emerge a Fibo retracement of the 2017-2018 drop and late-November lows.
- On the upside, there are no relevant hurdles until late-November’s peaks beyond 97.50.
DXY daily chart
Dollar Index Spot
Overview:
Today Last Price: 97.01
Today Daily change: 5.0 pips
Today Daily change %: 0.0516%
Today Daily Open: 96.96
Trends:
Previous Daily SMA20: 96.88
Previous Daily SMA50: 96.25
Previous Daily SMA100: 95.66
Previous Daily SMA200: 93.97
Levels:
Previous Daily High: 97.12
Previous Daily Low: 96.37
Previous Weekly High: 97.54
Previous Weekly Low: 96.62
Previous Monthly High: 97.7
Previous Monthly Low: 95.68
Previous Daily Fibonacci 38.2%: 96.83
Previous Daily Fibonacci 61.8%: 96.66
Previous Daily Pivot Point S1: 96.51
Previous Daily Pivot Point S2: 96.07
Previous Daily Pivot Point S3: 95.76
Previous Daily Pivot Point R1: 97.26
Previous Daily Pivot Point R2: 97.57
Previous Daily Pivot Point R3: 98.01
