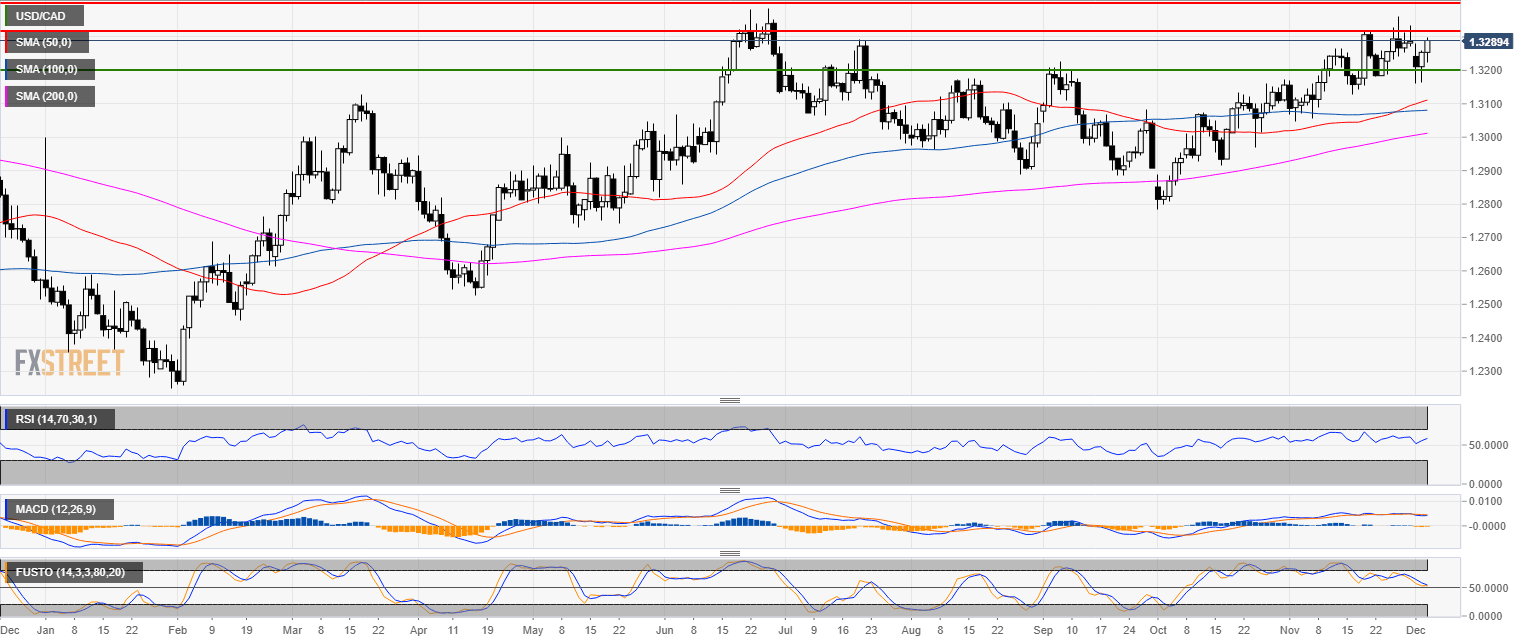
USD/CAD daily chart
- USD/CAD is trading in a bull trend below the 200-day simple moving average (SMA).
- The Bank of Canada rate statement is scheduled at 15.00 GMT. The event can lead to volatility in the market.
- The 1.3300 target got hit as forecast.
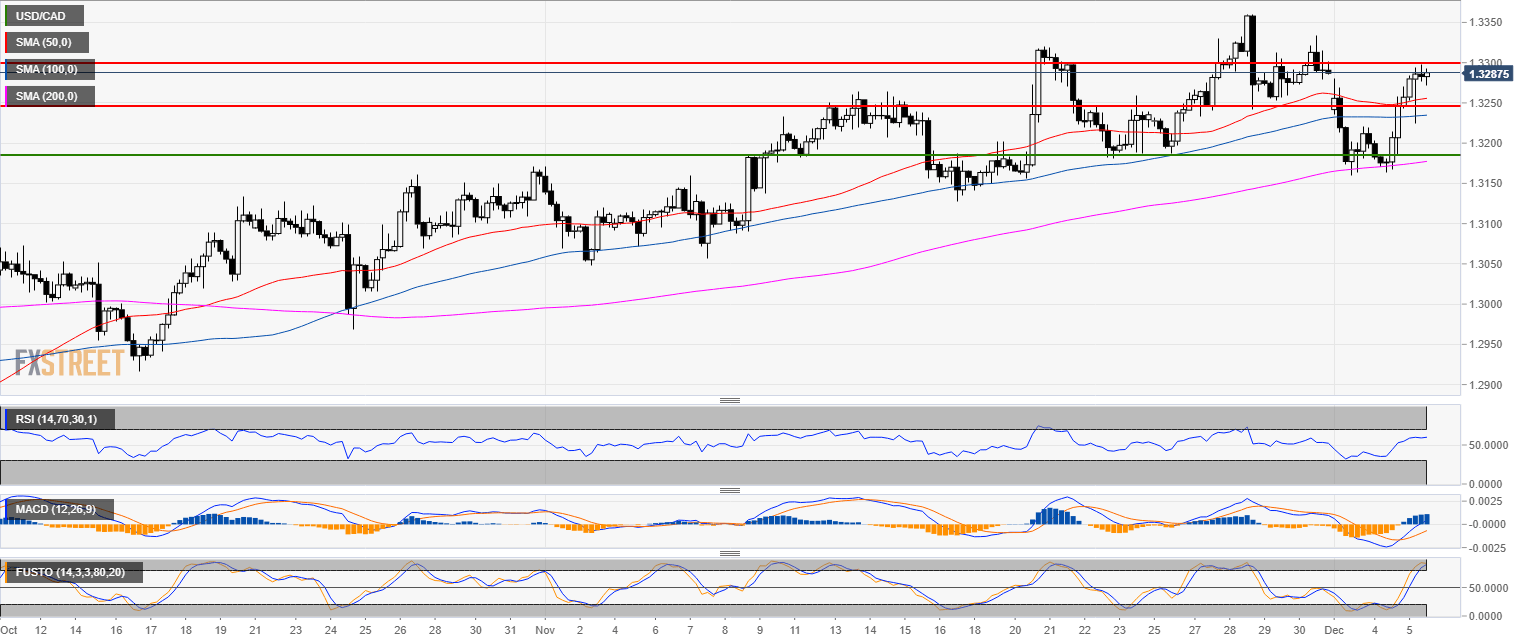
USD/CAD 4-hour chart
- The level to beat for bulls is 1.3300 figure.
- Failure to break the level can lead to a reversal down to the 1.3250 level.
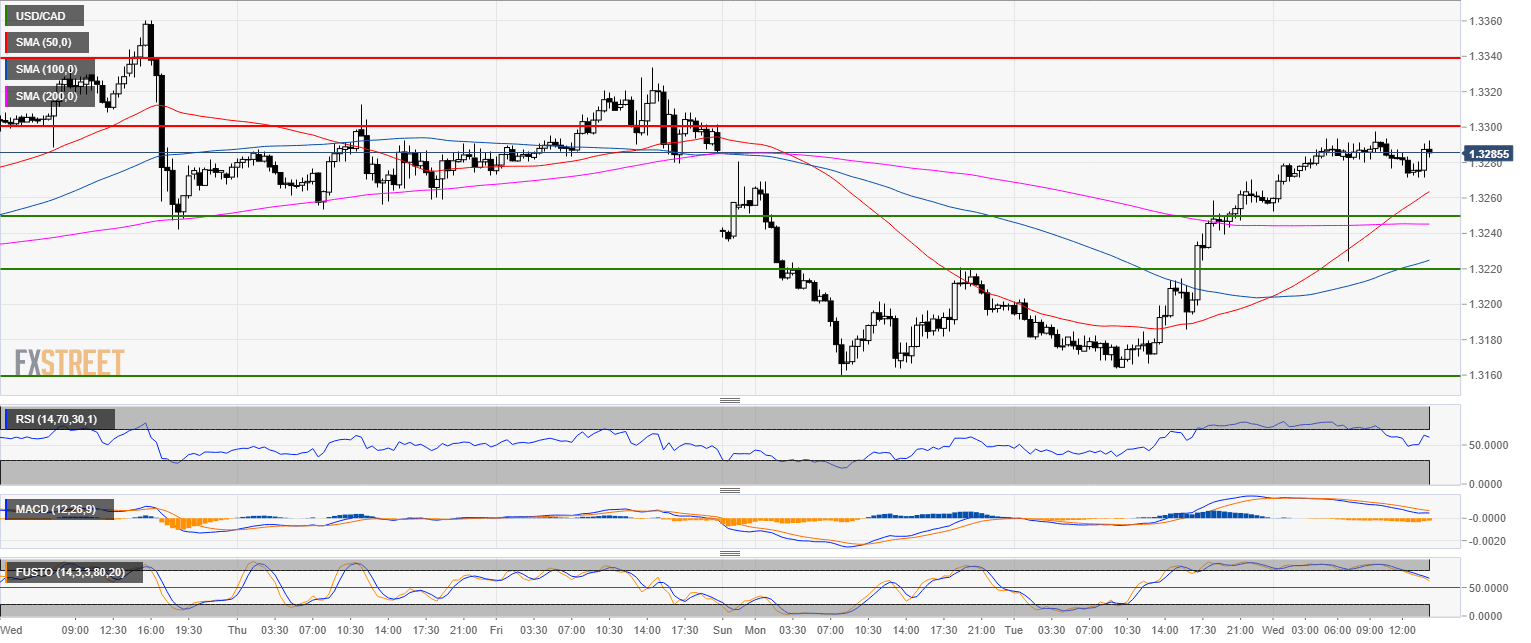
USD/CAD 30-minute chart
- The market is decelerating.
- Bear target at 1.3250 level. Alternativel a break of 1.3300 could lead to 1.3340 resistance.
Additional key levels
USD/CAD
Overview:
Today Last Price: 1.3285
Today Daily change: 31 pips
Today Daily change %: 0.234%
Today Daily Open: 1.3254
Trends:
Previous Daily SMA20: 1.3227
Previous Daily SMA50: 1.3106
Previous Daily SMA100: 1.308
Previous Daily SMA200: 1.3006
Levels:
Previous Daily High: 1.3258
Previous Daily Low: 1.3164
Previous Weekly High: 1.336
Previous Weekly Low: 1.3187
Previous Monthly High: 1.336
Previous Monthly Low: 1.3048
Previous Daily Fibonacci 38.2%: 1.3222
Previous Daily Fibonacci 61.8%: 1.32
Previous Daily Pivot Point S1: 1.3192
Previous Daily Pivot Point S2: 1.313
Previous Daily Pivot Point S3: 1.3097
Previous Daily Pivot Point R1: 1.3287
Previous Daily Pivot Point R2: 1.332
Previous Daily Pivot Point R3: 1.3382
