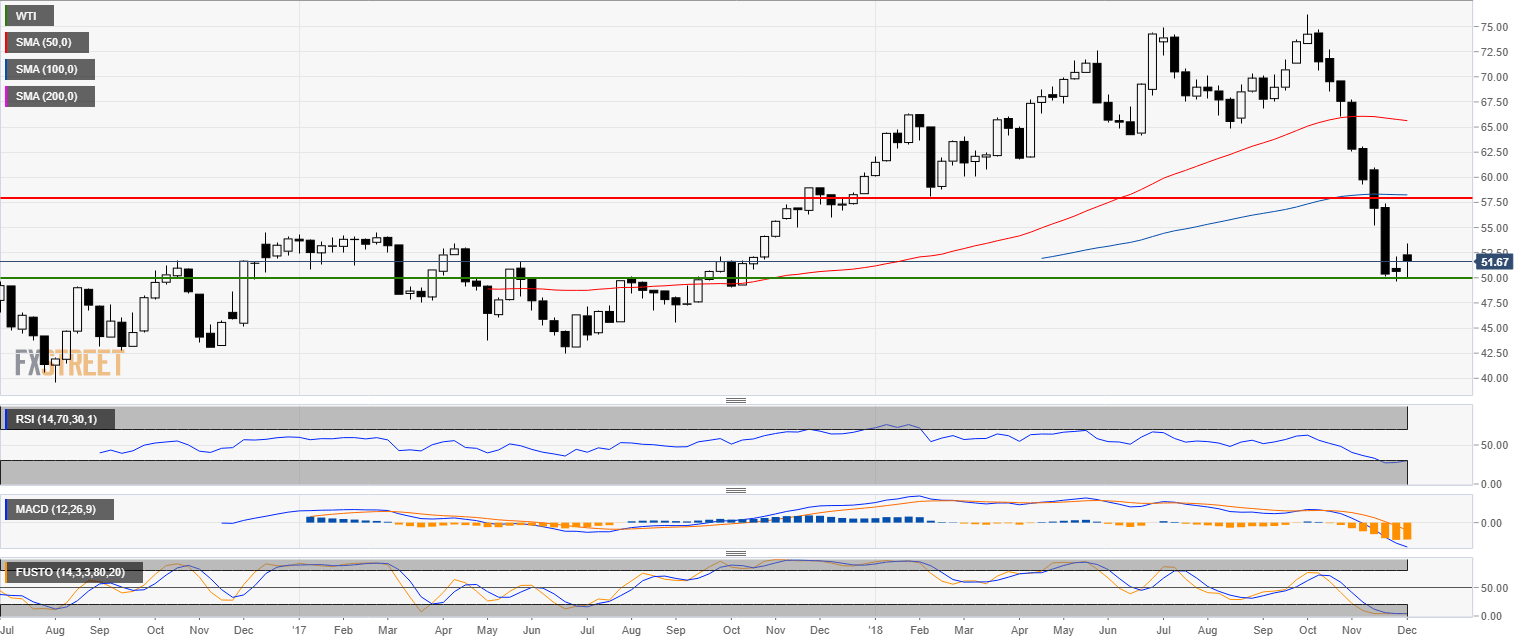
Oil weekly chart
- Oil WTI is trading in a bear trend as it reversed the yearly gains sharply.
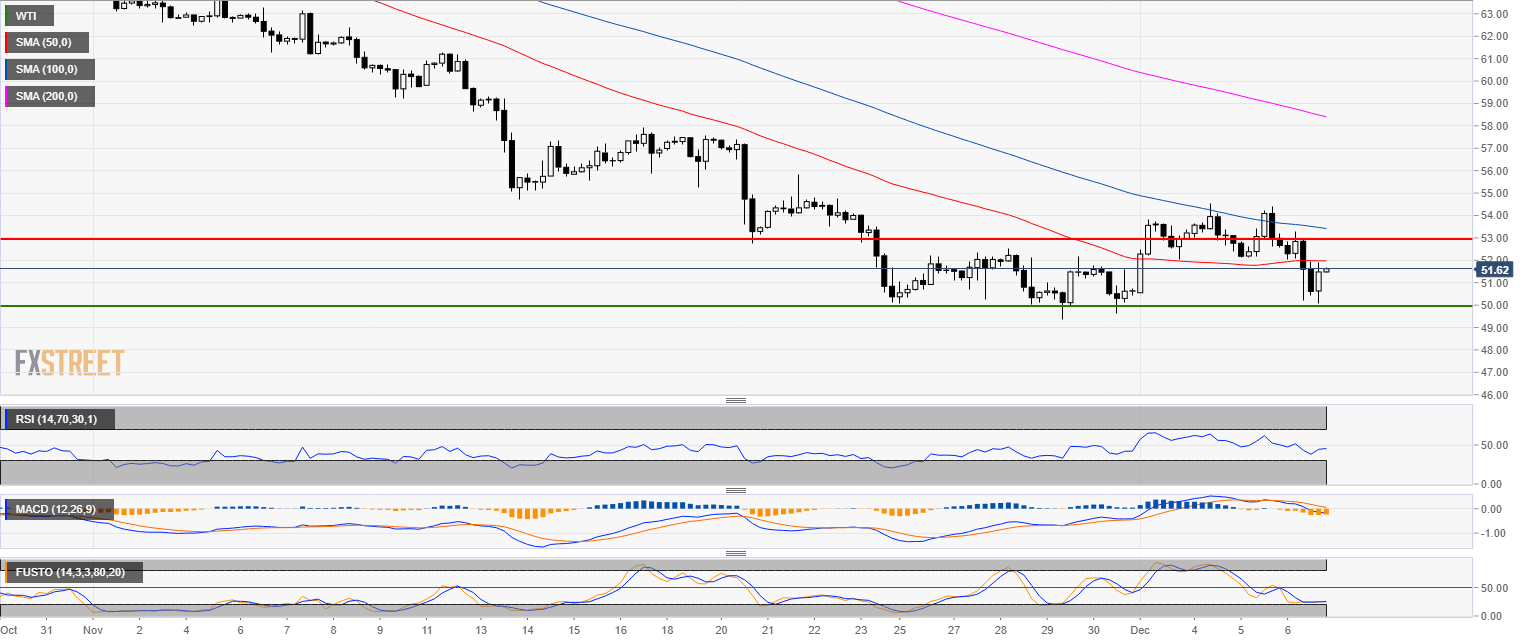
Oil 4-hour chart
- Oil tested the November lows.
- Oil is trading below its main SMAs.
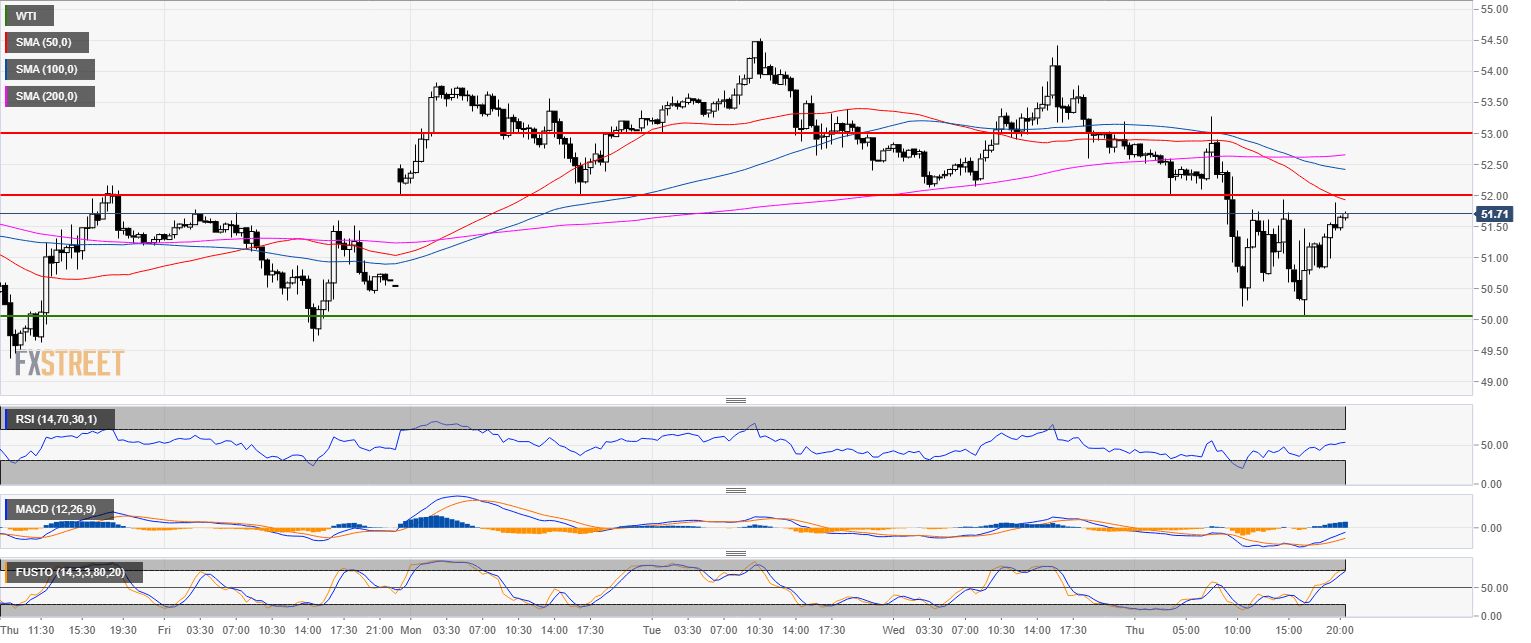
Oil 30-minute chart
- 52.00 is the level to beat for bulls.
- 53.00 is the bull target.
Additional key levels
WTI
Overview:
Today Last Price: 51.67
Today Daily change: -99 pips
Today Daily change %: -1.88%
Today Daily Open: 52.66
Trends:
Previous Daily SMA20: 53.48
Previous Daily SMA50: 61.42
Previous Daily SMA100: 65.63
Previous Daily SMA200: 67.31
Levels:
Previous Daily High: 53.19
Previous Daily Low: 52.58
Previous Weekly High: 52.13
Previous Weekly Low: 49.64
Previous Monthly High: 63.92
Previous Monthly Low: 49.64
Previous Daily Fibonacci 38.2%: 52.81
Previous Daily Fibonacci 61.8%: 52.96
Previous Daily Pivot Point S1: 52.43
Previous Daily Pivot Point S2: 52.2
Previous Daily Pivot Point S3: 51.82
Previous Daily Pivot Point R1: 53.04
Previous Daily Pivot Point R2: 53.42
Previous Daily Pivot Point R3: 53.65
