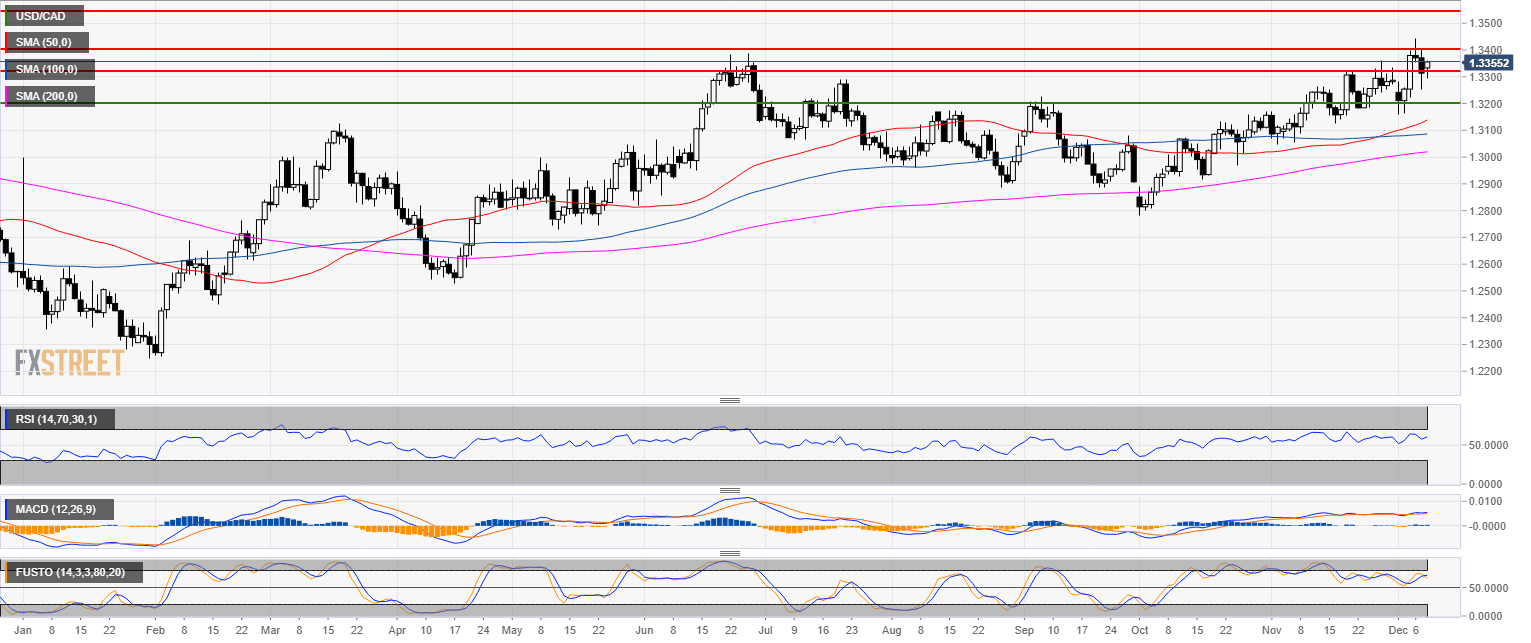
USD/CAD daily chart
- USD/CAD is trading in a bull trend above the 200-day simple moving average (SMA).
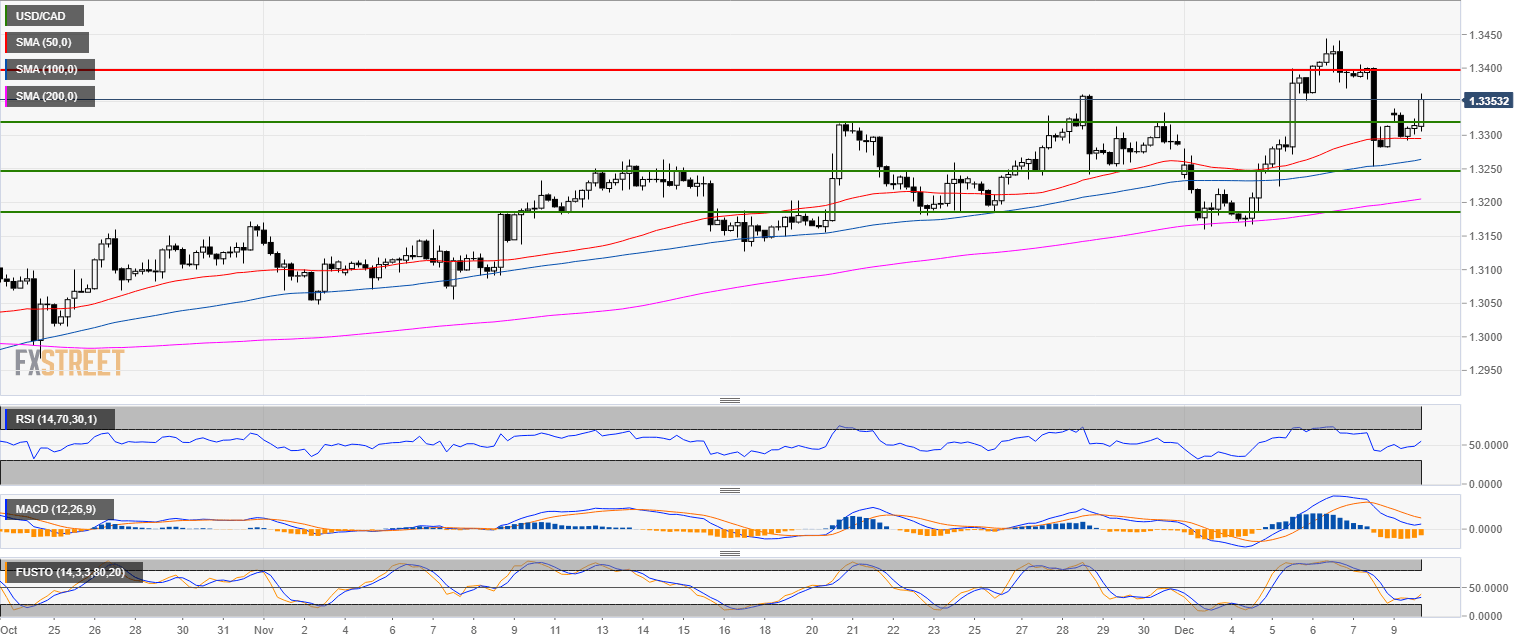
USD/CAD 4-hour chart
- USD/CAD bulls managed to hold above the 1.3300 figure and the 50 SMA.
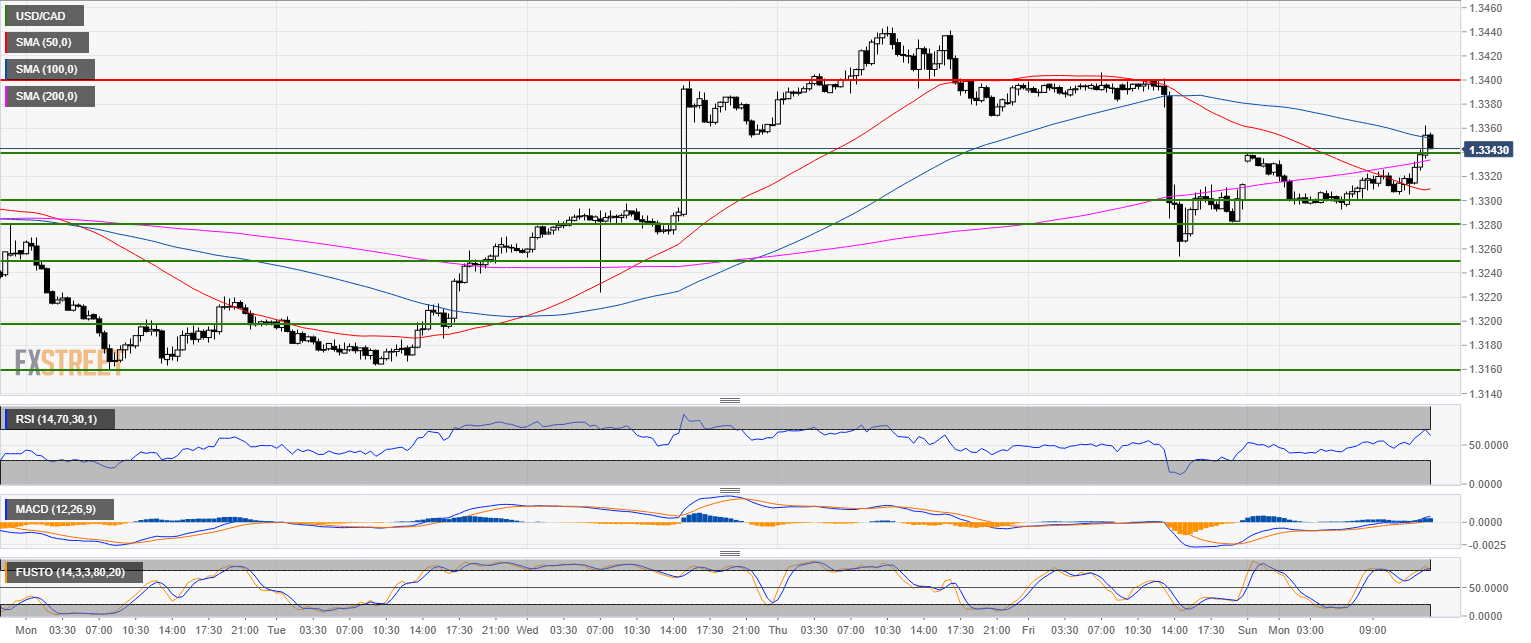
USD/CAD 30-minute chart
- Bulls broke above the 1.3340 resistance and the 200 SMA.
- The next target to the upside is likely located near the 1.1400 figure.
Additional key levels
