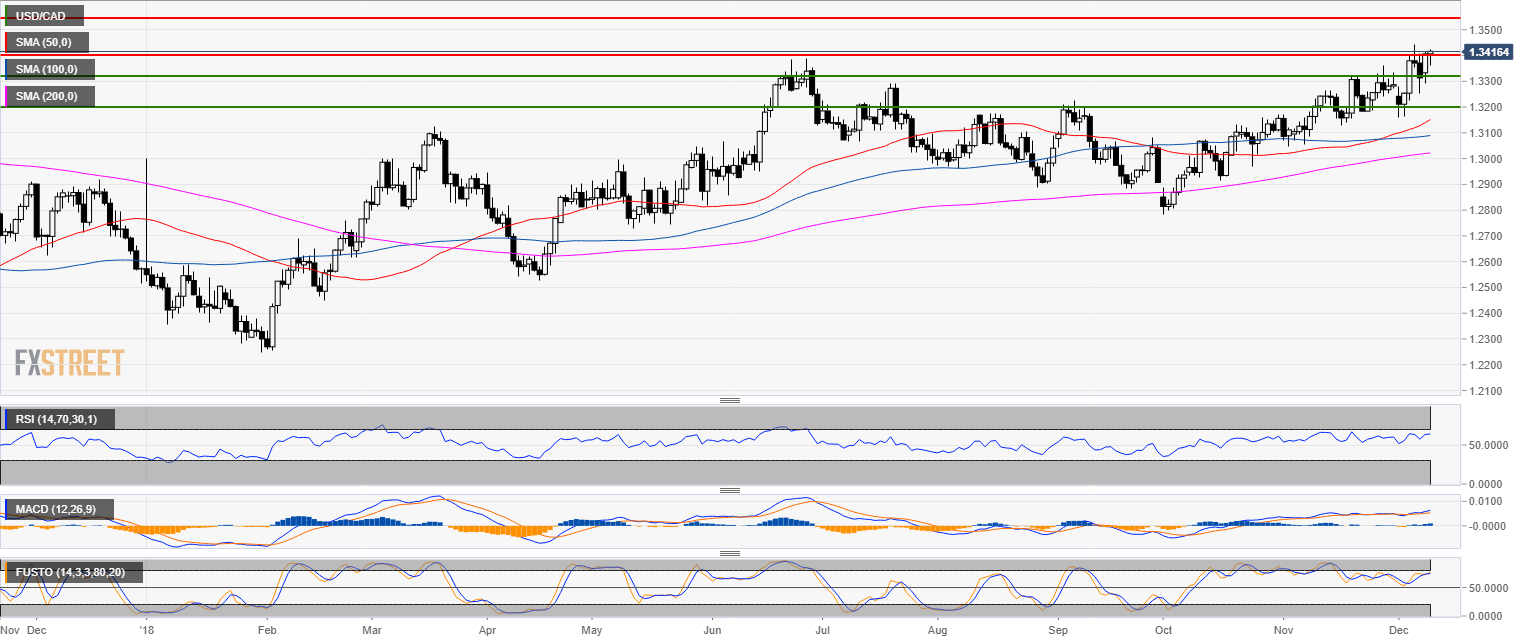
USD/CAD daily chart
- USD/CAD is trading in a bull trend above the 200-day simple moving average (SMA).
- As forecast, USD/CAD regained the 1.3400 figure.
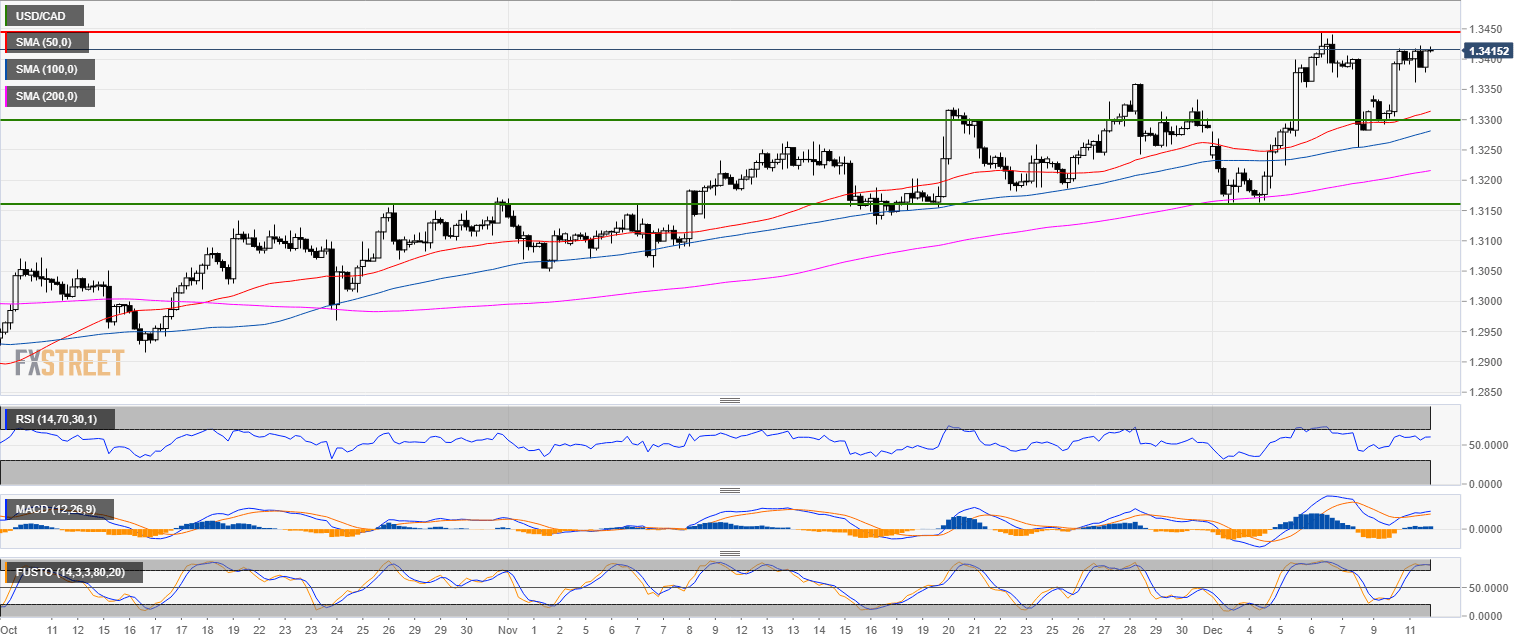
USD/CAD 4-hour chart
- 1.3450 is the level to beat for bulls.
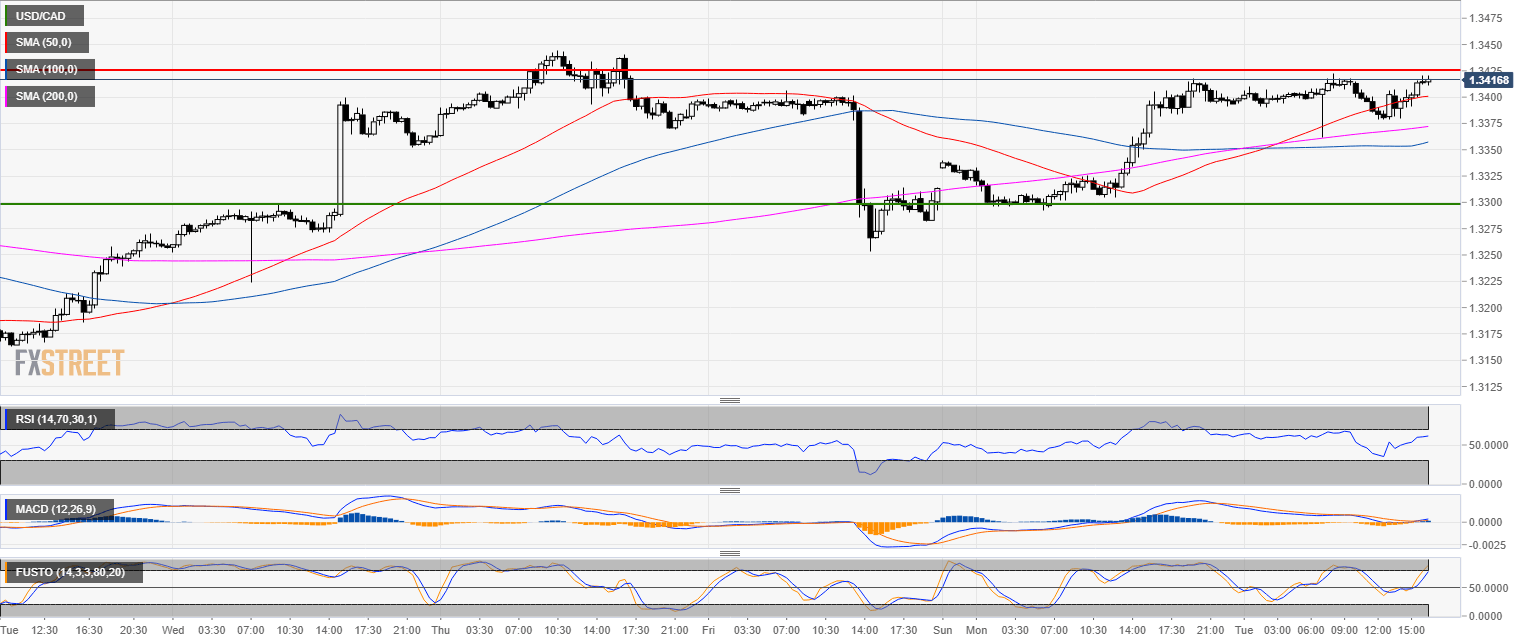
USD/CAD 30-minute chart
- The bull run has likely run its course for the time being as the market is likely set to correct to 1.3300 figure
Additional key levels
USD/CAD
Overview:
Today Last Price: 1.3416
Today Daily change: 10 pips
Today Daily change %: 0.0746%
Today Daily Open: 1.3406
Trends:
Previous Daily SMA20: 1.3264
Previous Daily SMA50: 1.314
Previous Daily SMA100: 1.3087
Previous Daily SMA200: 1.3019
Levels:
Previous Daily High: 1.3418
Previous Daily Low: 1.3292
Previous Weekly High: 1.3445
Previous Weekly Low: 1.316
Previous Monthly High: 1.336
Previous Monthly Low: 1.3048
Previous Daily Fibonacci 38.2%: 1.337
Previous Daily Fibonacci 61.8%: 1.334
Previous Daily Pivot Point S1: 1.3327
Previous Daily Pivot Point S2: 1.3247
Previous Daily Pivot Point S3: 1.3202
Previous Daily Pivot Point R1: 1.3452
Previous Daily Pivot Point R2: 1.3497
Previous Daily Pivot Point R3: 1.3577
