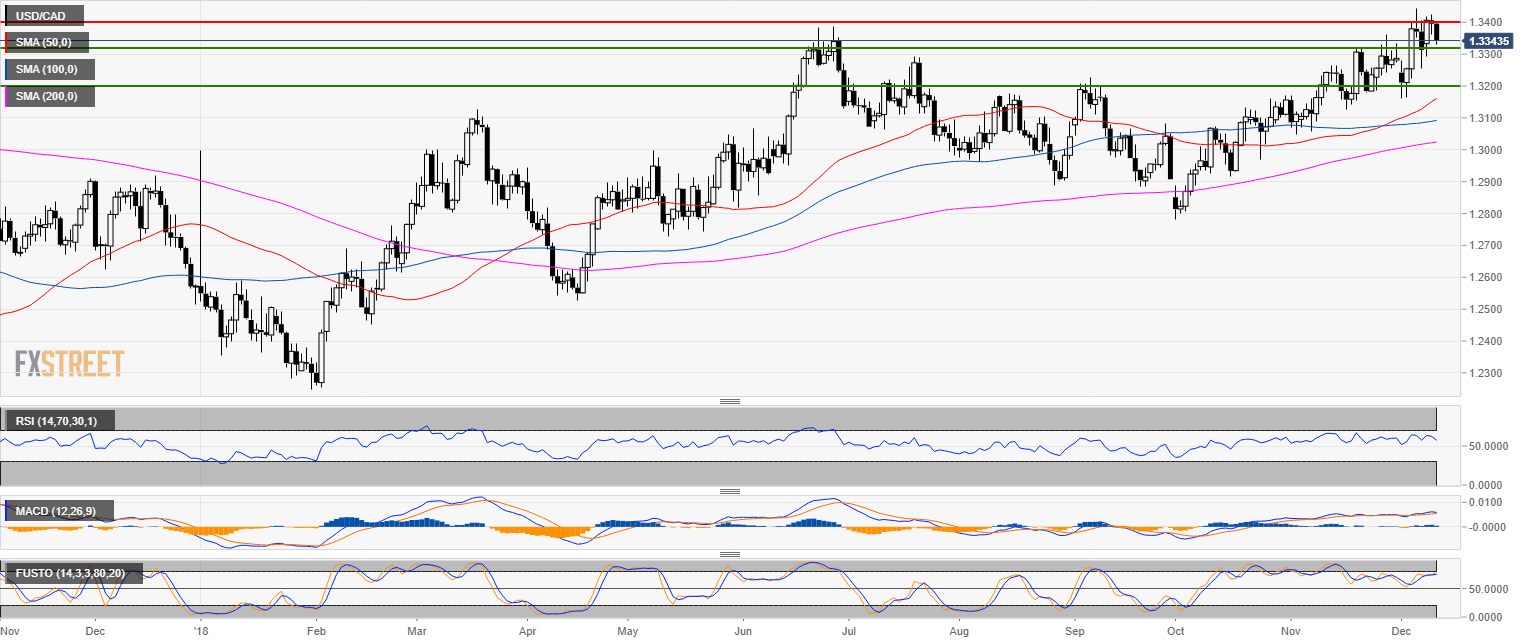
USD/CAD daily chart
- USD/CAD is trading in a bull trend above the 200-day simple moving average (SMA).
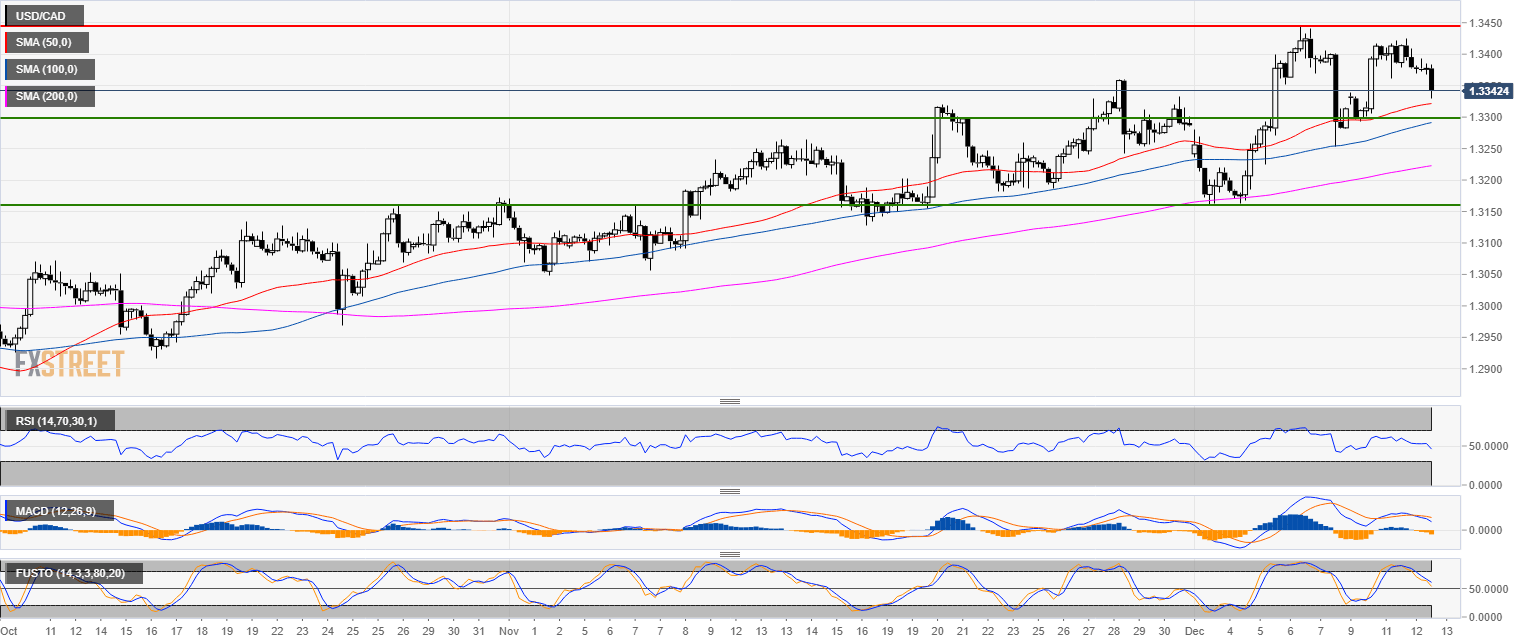
USD/CAD 4-hour chart
- USD/CAD is trading above its main SMAs.
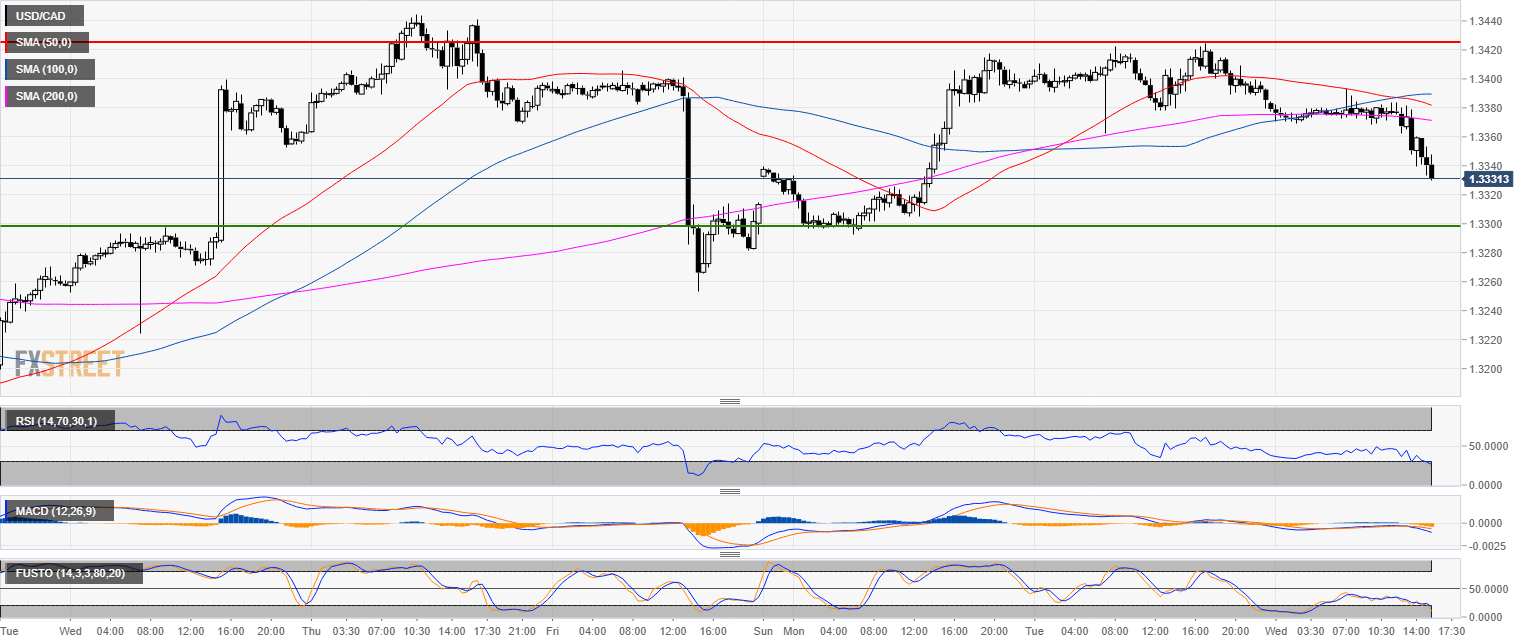
USD/CAD 30-minute
- On lower time-frames, USD/CAD broke below its main SMAs.
- The 1.3300 figure is most likely the next target to the downside.
Additional key levels
USD/CAD
Overview:
Today Last Price: 1.334
Today Daily change: -56 pips
Today Daily change %: -0.418%
Today Daily Open: 1.3396
Trends:
Previous Daily SMA20: 1.3272
Previous Daily SMA50: 1.3151
Previous Daily SMA100: 1.309
Previous Daily SMA200: 1.3021
Levels:
Previous Daily High: 1.3424
Previous Daily Low: 1.3362
Previous Weekly High: 1.3445
Previous Weekly Low: 1.316
Previous Monthly High: 1.336
Previous Monthly Low: 1.3048
Previous Daily Fibonacci 38.2%: 1.3386
Previous Daily Fibonacci 61.8%: 1.3401
Previous Daily Pivot Point S1: 1.3364
Previous Daily Pivot Point S2: 1.3332
Previous Daily Pivot Point S3: 1.3301
Previous Daily Pivot Point R1: 1.3426
Previous Daily Pivot Point R2: 1.3456
Previous Daily Pivot Point R3: 1.3489
