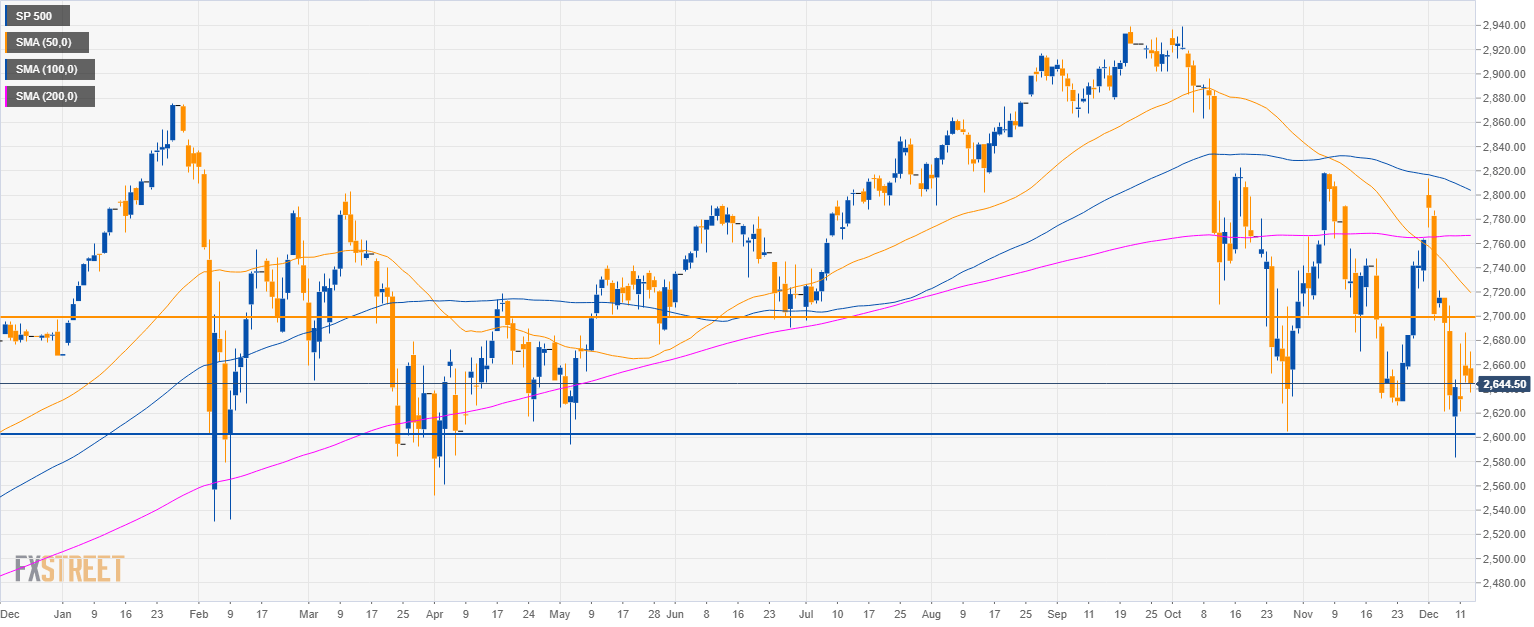
S&P500 daily chart
- The S&P500 index is having a deep pullback down below the 200-day simple moving average (SMA).
- The S&P500 is currently managing to hold near the 2-month’s low.
- If bulls can hold prices above 2,600.00 then 2,700.00 and 2,750.00 can be the next bull targets. On the flip side, a bear breakout below 2,600.00 can open the doors to the 2,570.00 level.
Additional key levels
Dollar Index Spot
Overview:
Today Last Price: 97.08
Today Daily change: 3.0 pips
Today Daily change %: 0.0309%
Today Daily Open: 97.05
Trends:
Previous Daily SMA20: 96.9
Previous Daily SMA50: 96.47
Previous Daily SMA100: 95.8
Previous Daily SMA200: 94.18
Levels:
Previous Daily High: 97.49
Previous Daily Low: 96.89
Previous Weekly High: 97.21
Previous Weekly Low: 96.37
Previous Monthly High: 97.7
Previous Monthly Low: 95.68
Previous Daily Fibonacci 38.2%: 97.12
Previous Daily Fibonacci 61.8%: 97.26
Previous Daily Pivot Point S1: 96.8
Previous Daily Pivot Point S2: 96.54
Previous Daily Pivot Point S3: 96.2
Previous Daily Pivot Point R1: 97.4
Previous Daily Pivot Point R2: 97.74
Previous Daily Pivot Point R3: 98
