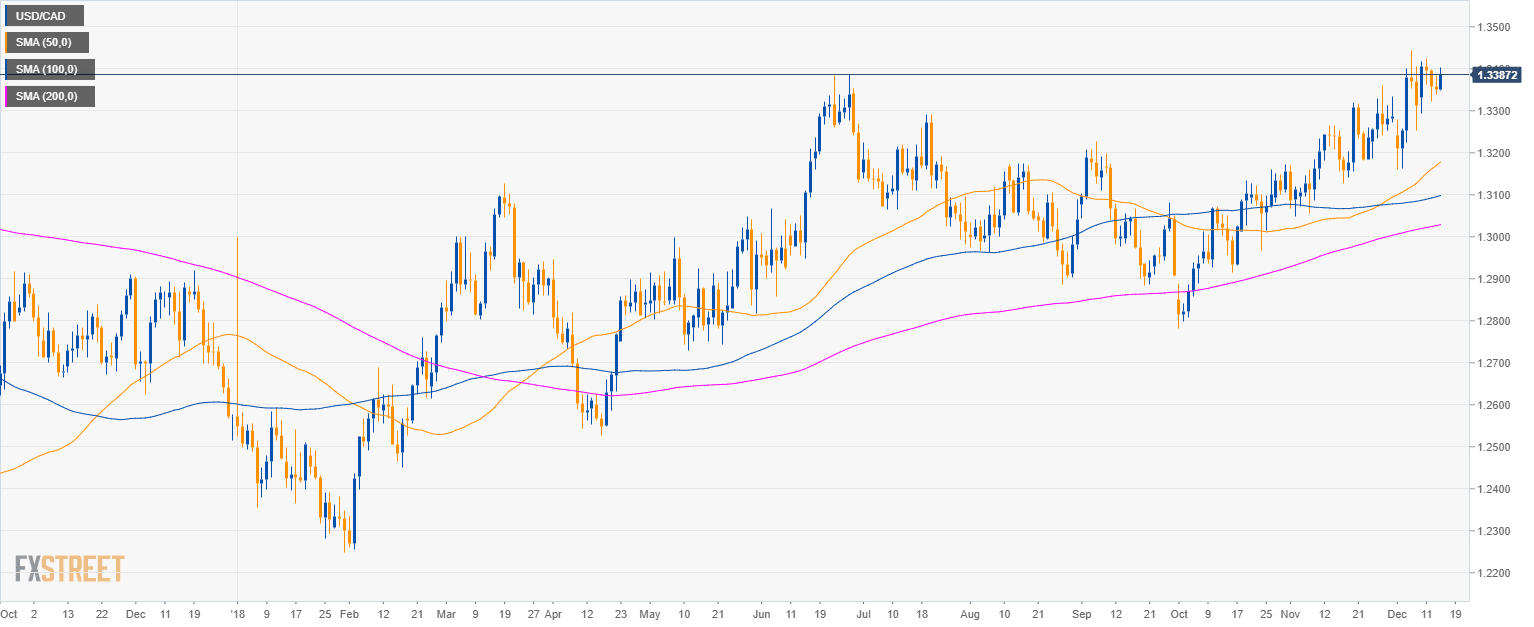
USD/CAD daily chart
- USD/CAD is trading in a bull trend above the 50, 100 and 200-day simple moving averages (SMAs).
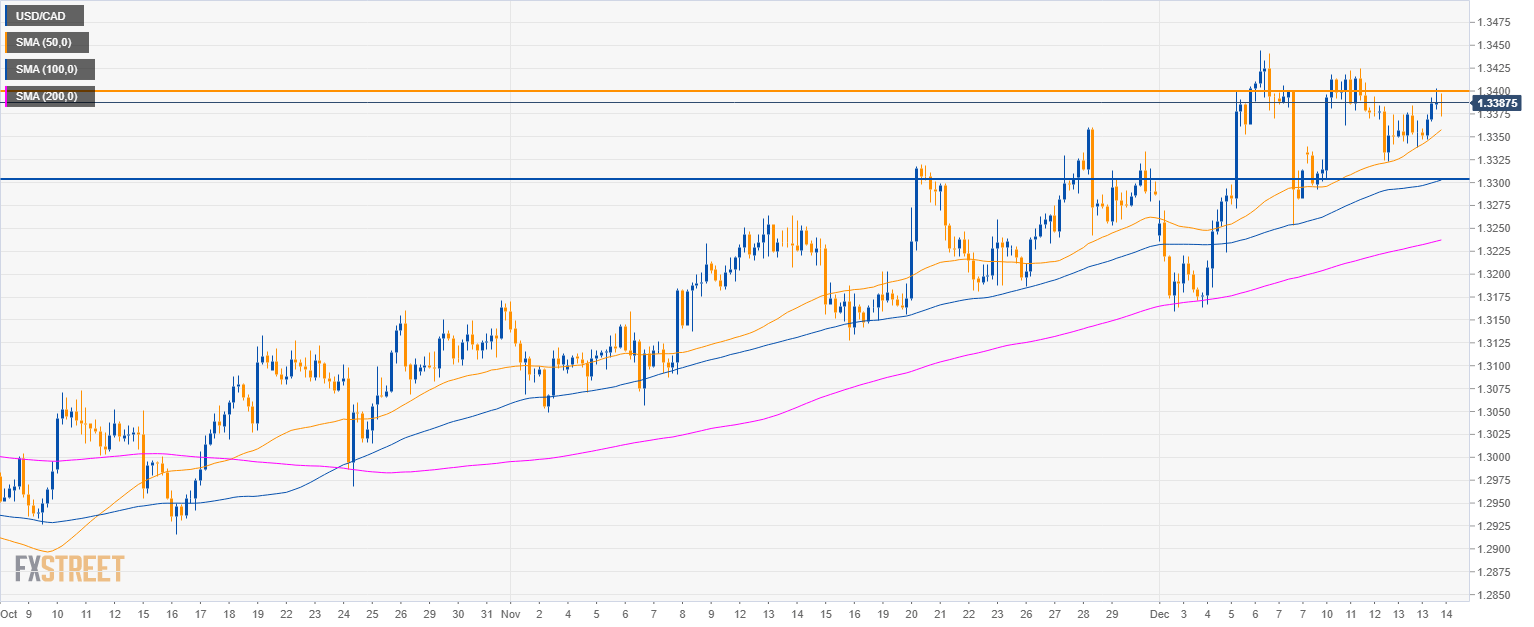
USD/CAD 4-hour chart
- 1.3400 figure is the level to beat for bulls.
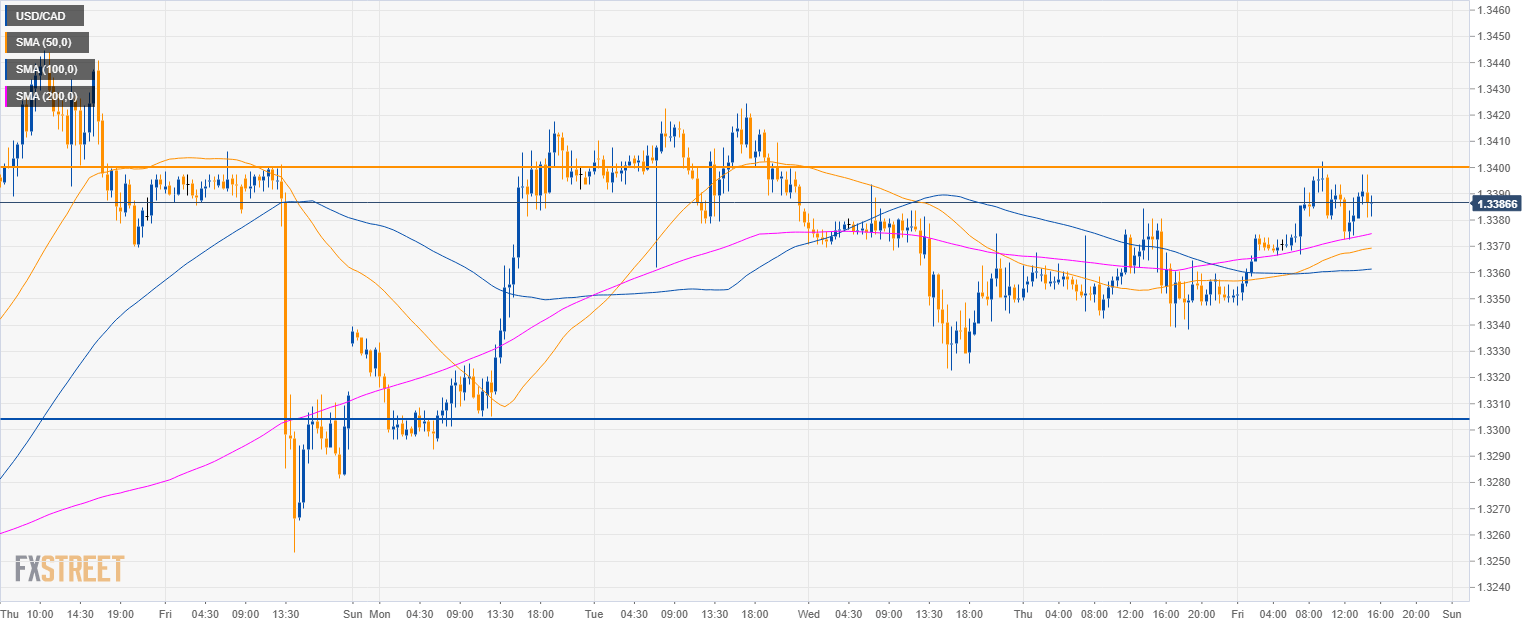
USD/CAD 30-minute chart
- USD/CAD is finding resistance at the 1.3400 figure. Any rally above it seems, at this stage, unsustainable.
- The next target is likely going to be the 1.3300 figure to the downside.
Additional key levels
USD/CAD
Overview:
Today Last Price: 1.3386
Today Daily change: 34 pips
Today Daily change %: 0.255%
Today Daily Open: 1.3352
Trends:
Previous Daily SMA20: 1.3286
Previous Daily SMA50: 1.3169
Previous Daily SMA100: 1.3095
Previous Daily SMA200: 1.3026
Levels:
Previous Daily High: 1.3384
Previous Daily Low: 1.3338
Previous Weekly High: 1.3445
Previous Weekly Low: 1.316
Previous Monthly High: 1.336
Previous Monthly Low: 1.3048
Previous Daily Fibonacci 38.2%: 1.3356
Previous Daily Fibonacci 61.8%: 1.3367
Previous Daily Pivot Point S1: 1.3332
Previous Daily Pivot Point S2: 1.3312
Previous Daily Pivot Point S3: 1.3286
Previous Daily Pivot Point R1: 1.3378
Previous Daily Pivot Point R2: 1.3404
Previous Daily Pivot Point R3: 1.3424
