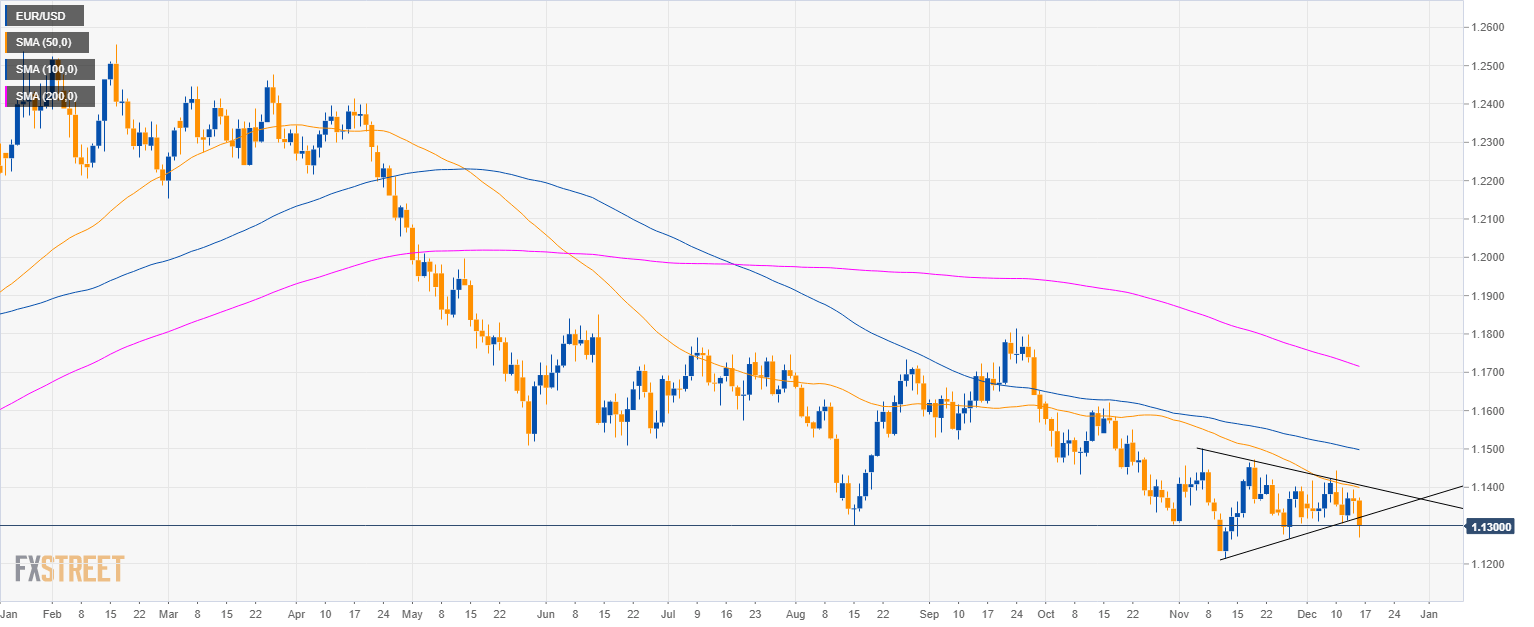
EUR/USD daily chart
- EUR/USD is trading in a bear trend below the 50, 100 and 200-day simple moving averages.
- EUR/USD broke below a triangle pattern.
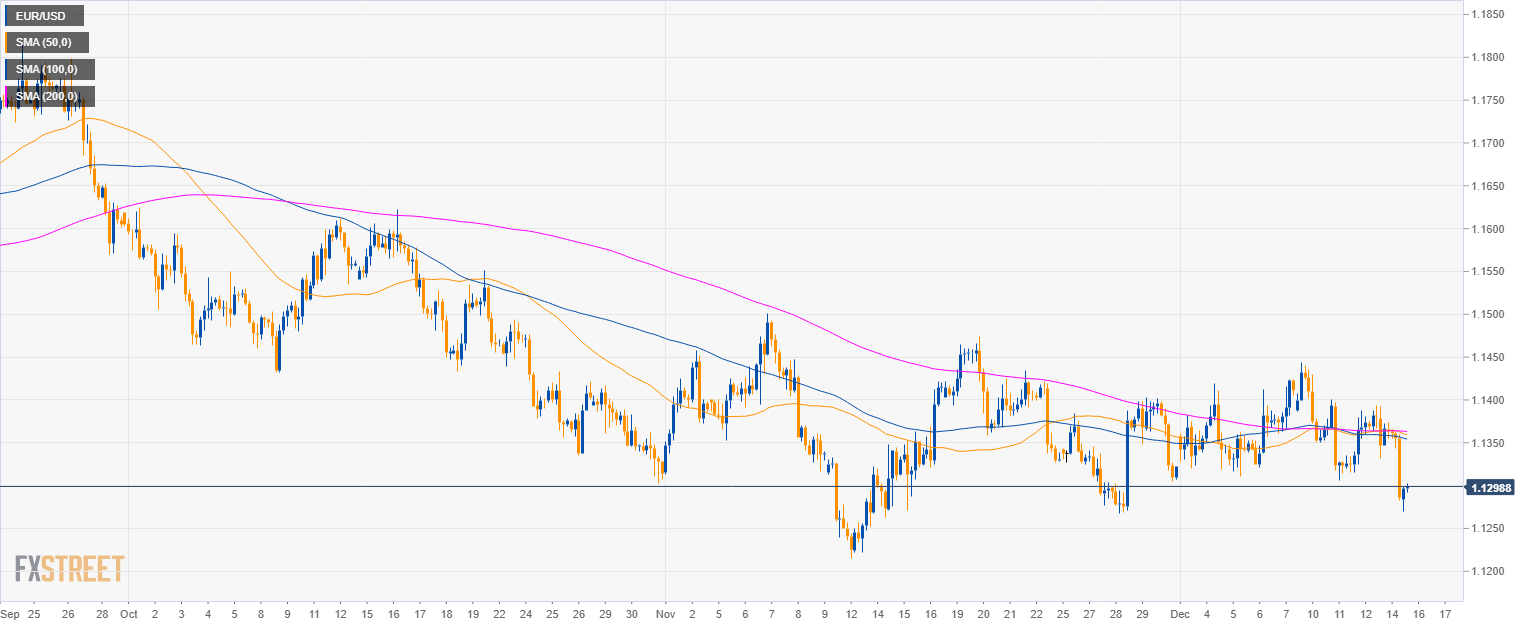
EUR/USD 4-hour chart
- While the market broke from a triangle on the daily chart, EUR/USD also found support at the November 28 low.
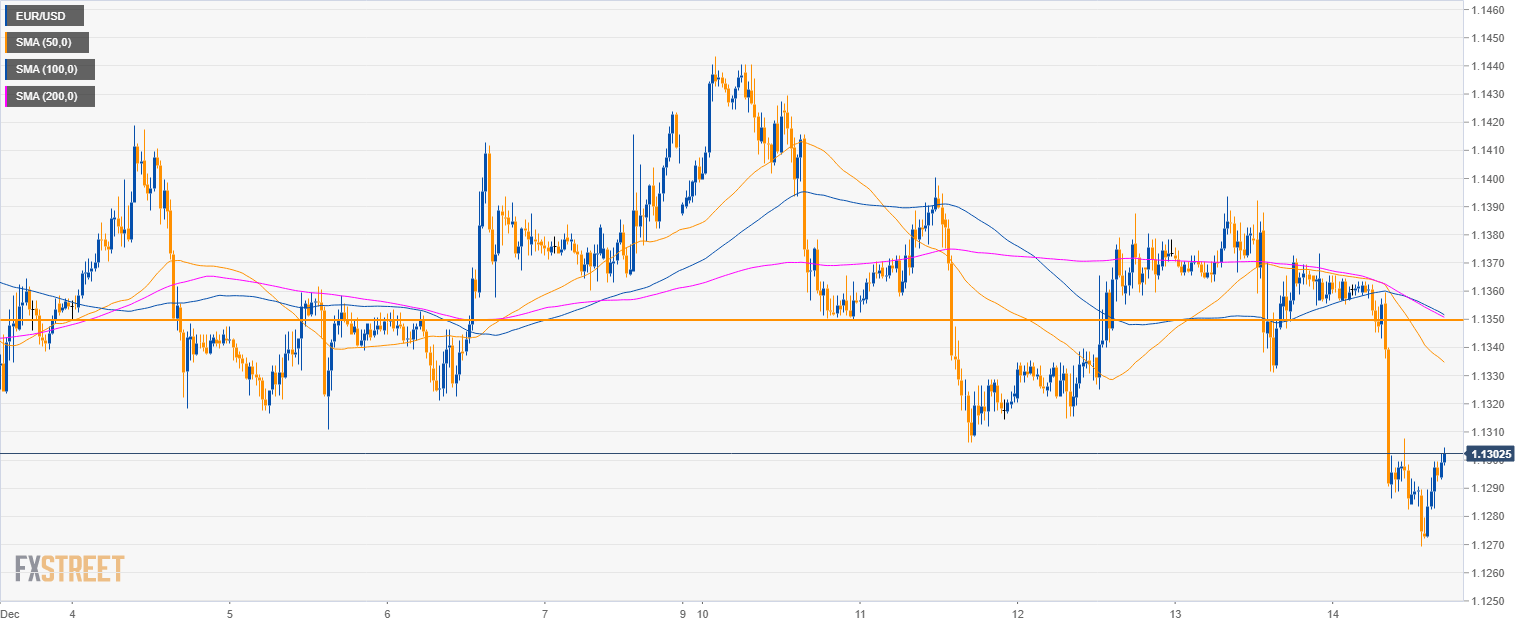
EUR/USD 30-minute chart
- EUR/USD is most likely to correct the downside move by trading up to the 1.1350 resistance in the coming sessions.
Additional key levels
EUR/USD
Overview:
Today Last Price: 1.1299
Today Daily change: -65 pips
Today Daily change %: -0.572%
Today Daily Open: 1.1364
Trends:
Previous Daily SMA20: 1.1365
Previous Daily SMA50: 1.1403
Previous Daily SMA100: 1.1501
Previous Daily SMA200: 1.1723
Levels:
Previous Daily High: 1.1394
Previous Daily Low: 1.1331
Previous Weekly High: 1.1424
Previous Weekly Low: 1.1311
Previous Monthly High: 1.15
Previous Monthly Low: 1.1216
Previous Daily Fibonacci 38.2%: 1.1355
Previous Daily Fibonacci 61.8%: 1.137
Previous Daily Pivot Point S1: 1.1332
Previous Daily Pivot Point S2: 1.13
Previous Daily Pivot Point S3: 1.127
Previous Daily Pivot Point R1: 1.1395
Previous Daily Pivot Point R2: 1.1426
Previous Daily Pivot Point R3: 1.1457
