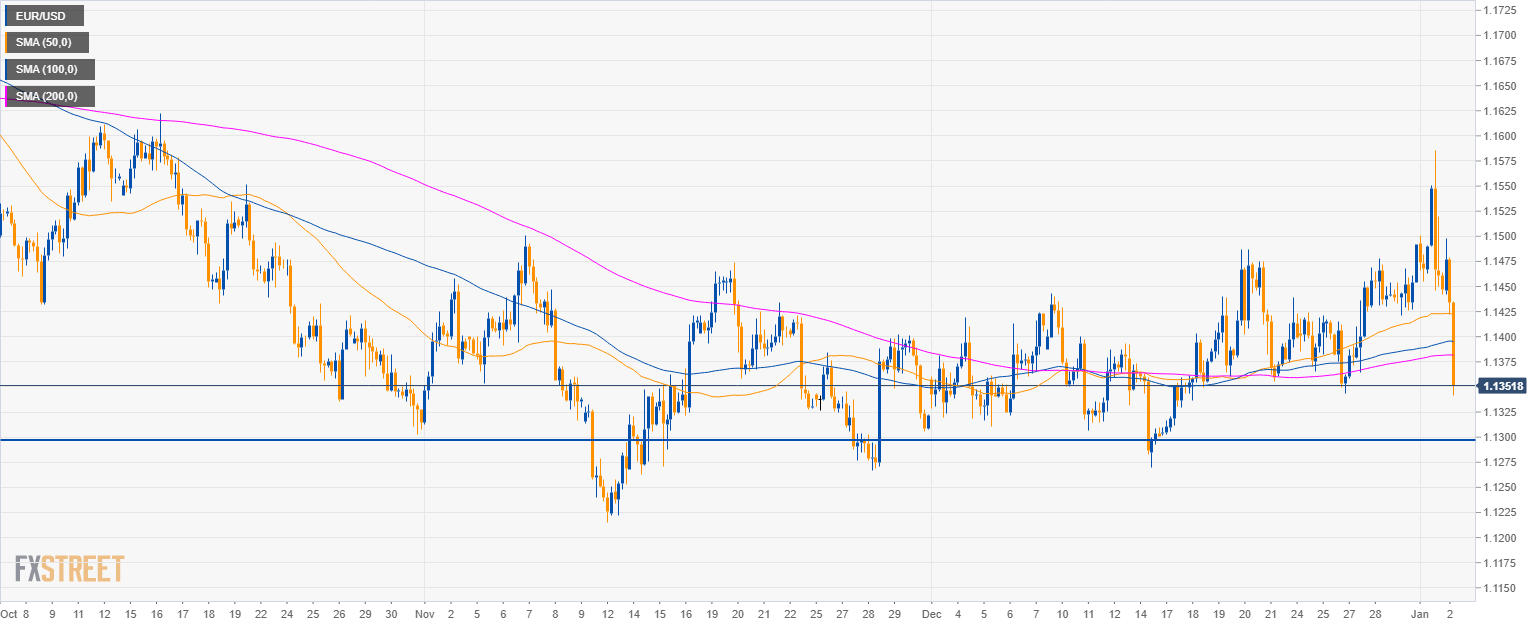
EUR/USD daily chart
- EUR/USD is trading in a bear trend below the 50, 100 and 200-period simple moving average (SMA).
- As forecast the 1.1340 support got hit.
-636820410665549543.png)
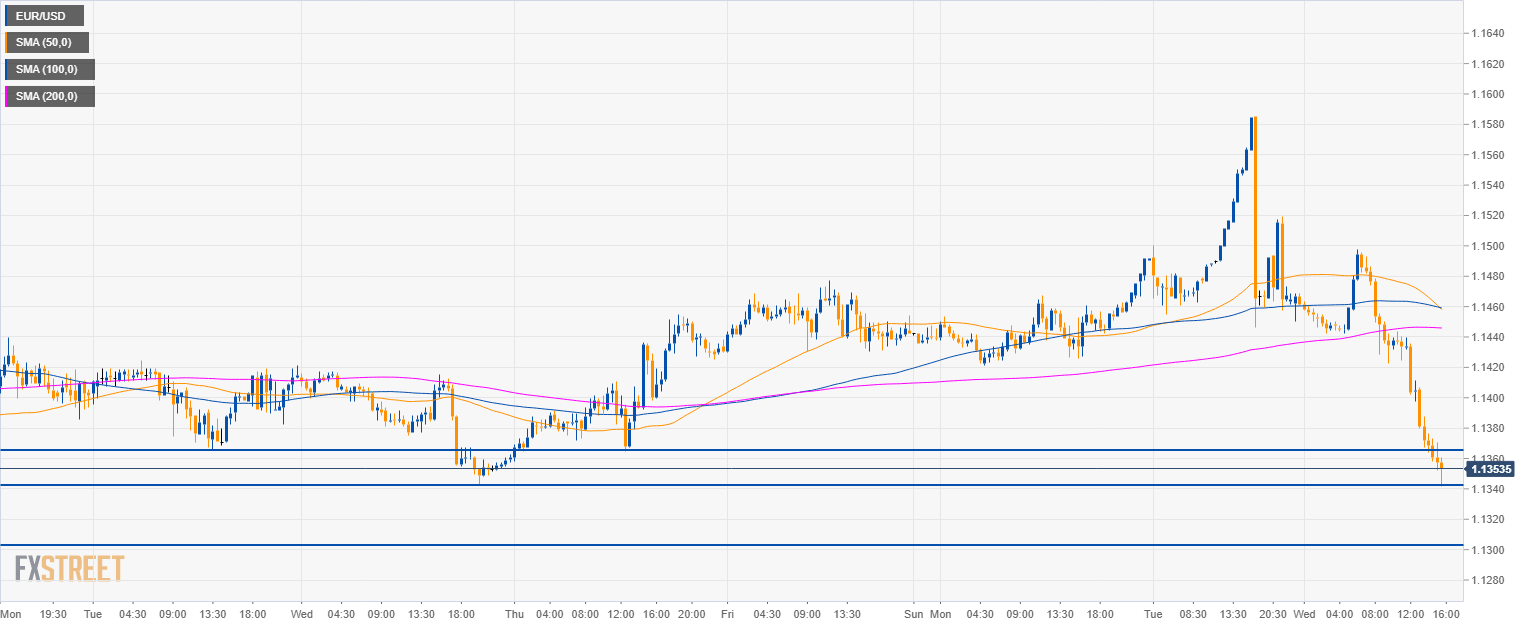
EUR/USD 4-hour chart
- EUR/USD rejected the 1.1600, 1.1500 and 1.1400 psychological levels in less than 24 hours.
EUR/USD 30-minute chart
- EUR/USD is falling down fast as it broke below the 1.1350 level.
- The trend is bearish and additional losses can see 1.1300 become the next bear target in the coming sessions.
Additional key levels:
EUR/USD
Overview:
Today Last Price: 1.1352
Today Daily change: -1.2e+2 pips
Today Daily change %: -1.05%
Today Daily Open: 1.1473
Trends:
Previous Daily SMA20: 1.1387
Previous Daily SMA50: 1.1372
Previous Daily SMA100: 1.148
Previous Daily SMA200: 1.1662
Levels:
Previous Daily High: 1.1586
Previous Daily Low: 1.1446
Previous Weekly High: 1.1478
Previous Weekly Low: 1.1343
Previous Monthly High: 1.1486
Previous Monthly Low: 1.1269
Previous Daily Fibonacci 38.2%: 1.1532
Previous Daily Fibonacci 61.8%: 1.15
Previous Daily Pivot Point S1: 1.1418
Previous Daily Pivot Point S2: 1.1362
Previous Daily Pivot Point S3: 1.1278
Previous Daily Pivot Point R1: 1.1556
Previous Daily Pivot Point R2: 1.164
Previous Daily Pivot Point R3: 1.1696
