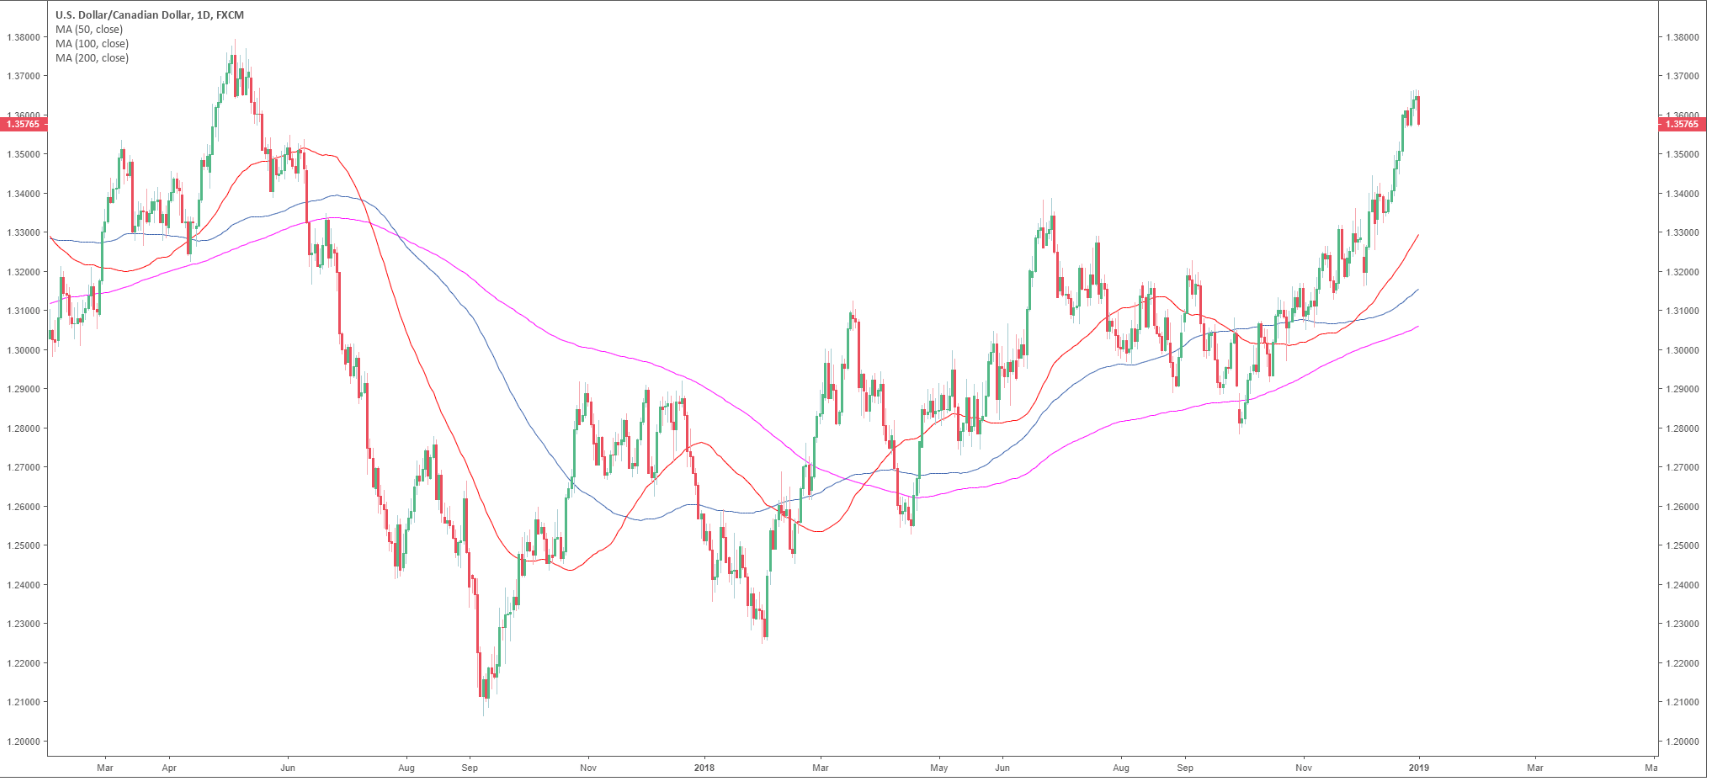
USD/CAD daily chart
- USD/CAD is trading in a bull trend above the 50, 100 and 200-period simple moving average (SMAs).
- USD/CAD is testing the May 2017 highs.
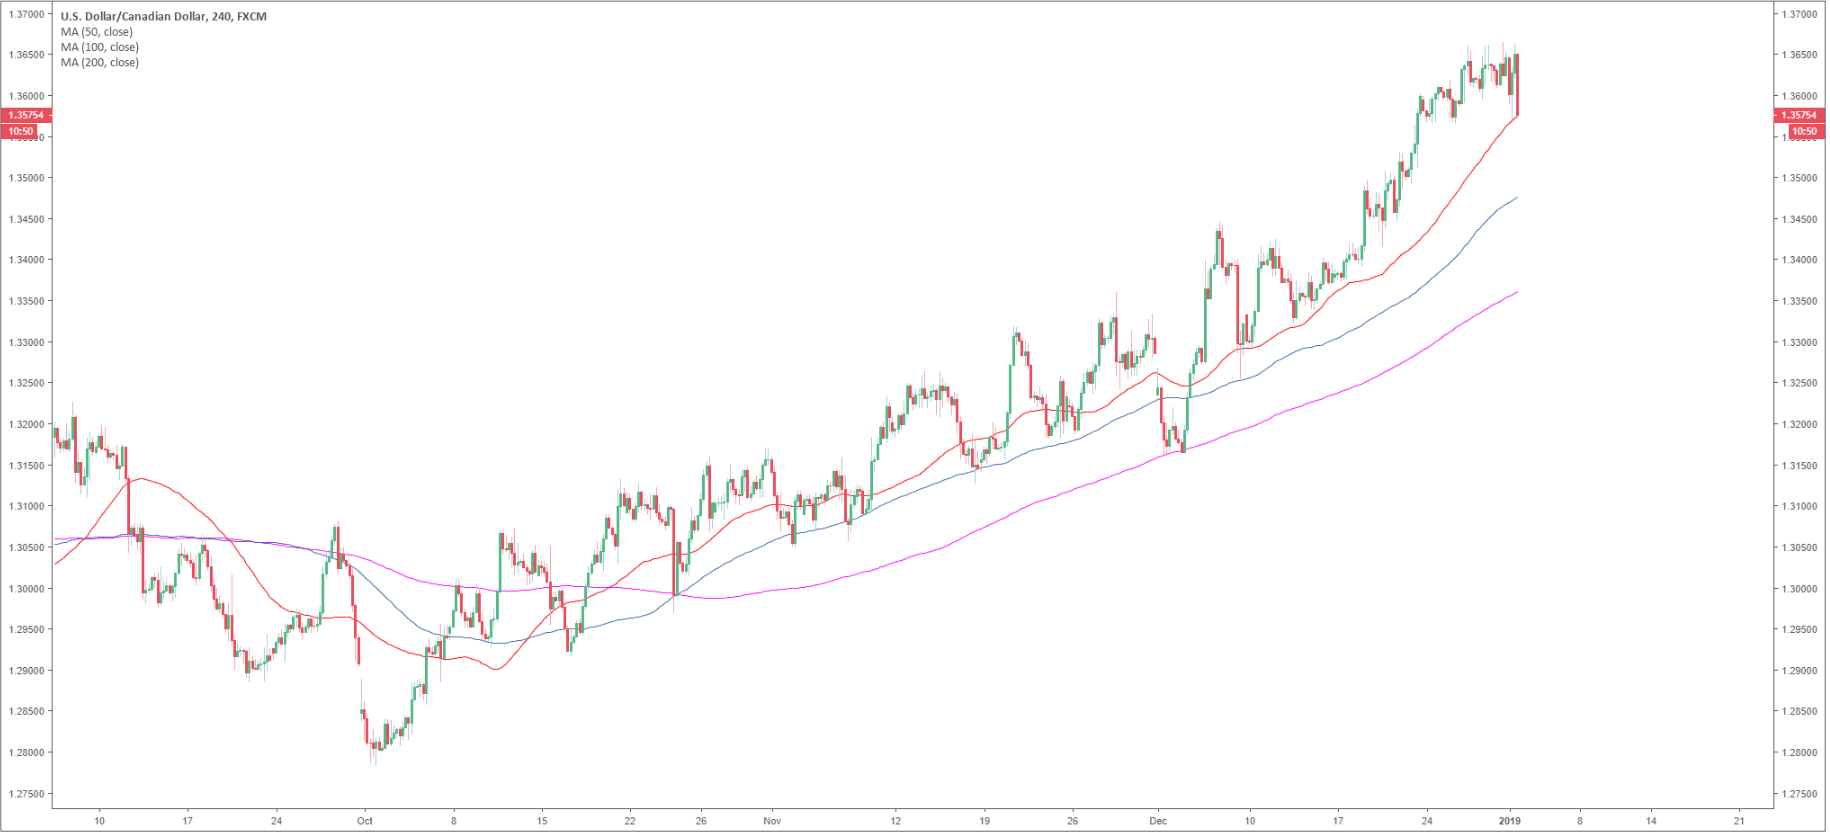
USD/CAD 4-hour chart
- USD/CAD is pulling back to the 50 SMA.
USD/CAD 30-minute chart
- USD/CAD broke below the 50, 100 and 200 SMAs.
- A sustained break below 1.3580 can lead to a bearish continuation to the 1.3540 level.
- The 1.3600 figure should act as resistance in the short-term.

Additional key levels:
USD/CAD
Overview:
Today Last Price: 1.3577
Today Daily change: -63 pips
Today Daily change %: -0.462%
Today Daily Open: 1.364
Trends:
Previous Daily SMA20: 1.3513
Previous Daily SMA50: 1.3317
Previous Daily SMA100: 1.3166
Previous Daily SMA200: 1.3067
Levels:
Previous Daily High: 1.3658
Previous Daily Low: 1.3422
Previous Weekly High: 1.4134
Previous Weekly Low: 1.3564
Previous Monthly High: 1.4134
Previous Monthly Low: 1.316
Previous Daily Fibonacci 38.2%: 1.3512
Previous Daily Fibonacci 61.8%: 1.3568
Previous Daily Pivot Point S1: 1.3489
Previous Daily Pivot Point S2: 1.3337
Previous Daily Pivot Point S3: 1.3252
Previous Daily Pivot Point R1: 1.3725
Previous Daily Pivot Point R2: 1.381
Previous Daily Pivot Point R3: 1.3962
