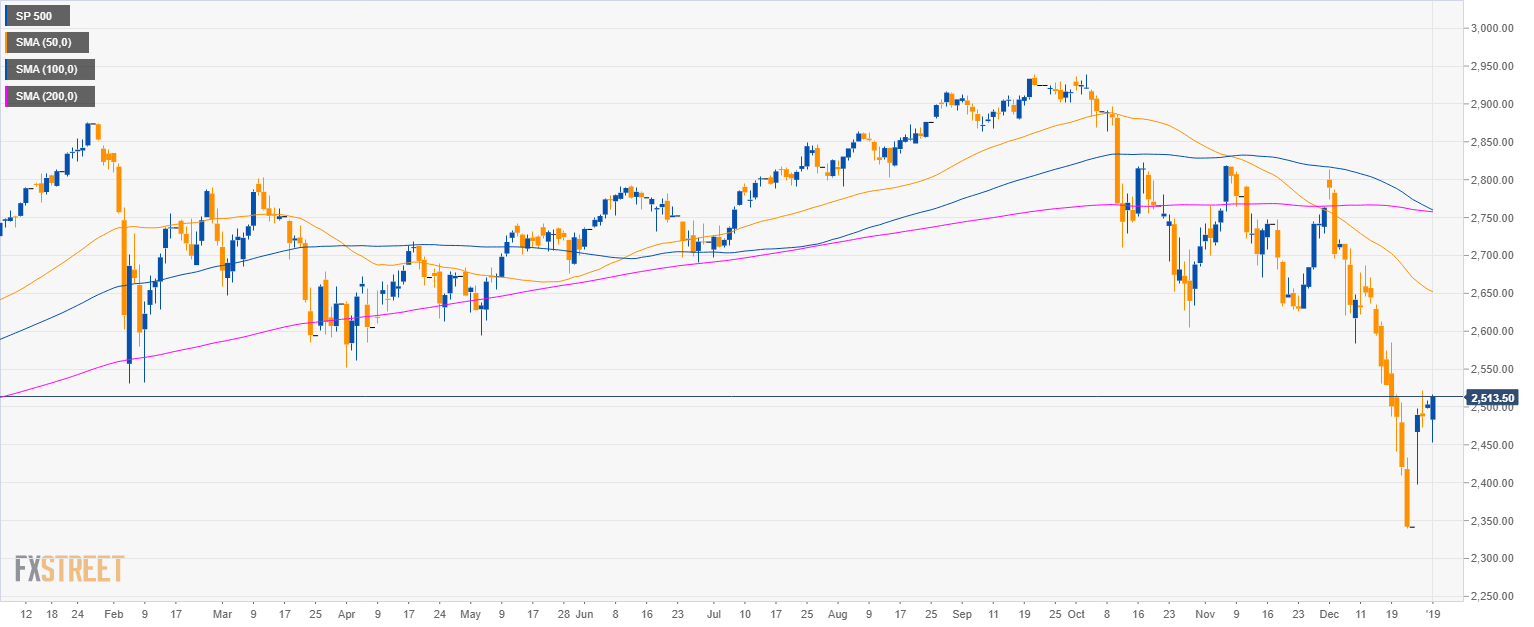
S&P500 daily chart
- The S&P500 is having a deep pullback below the 50, 100 and 200-period simple moving averages (SMAs).
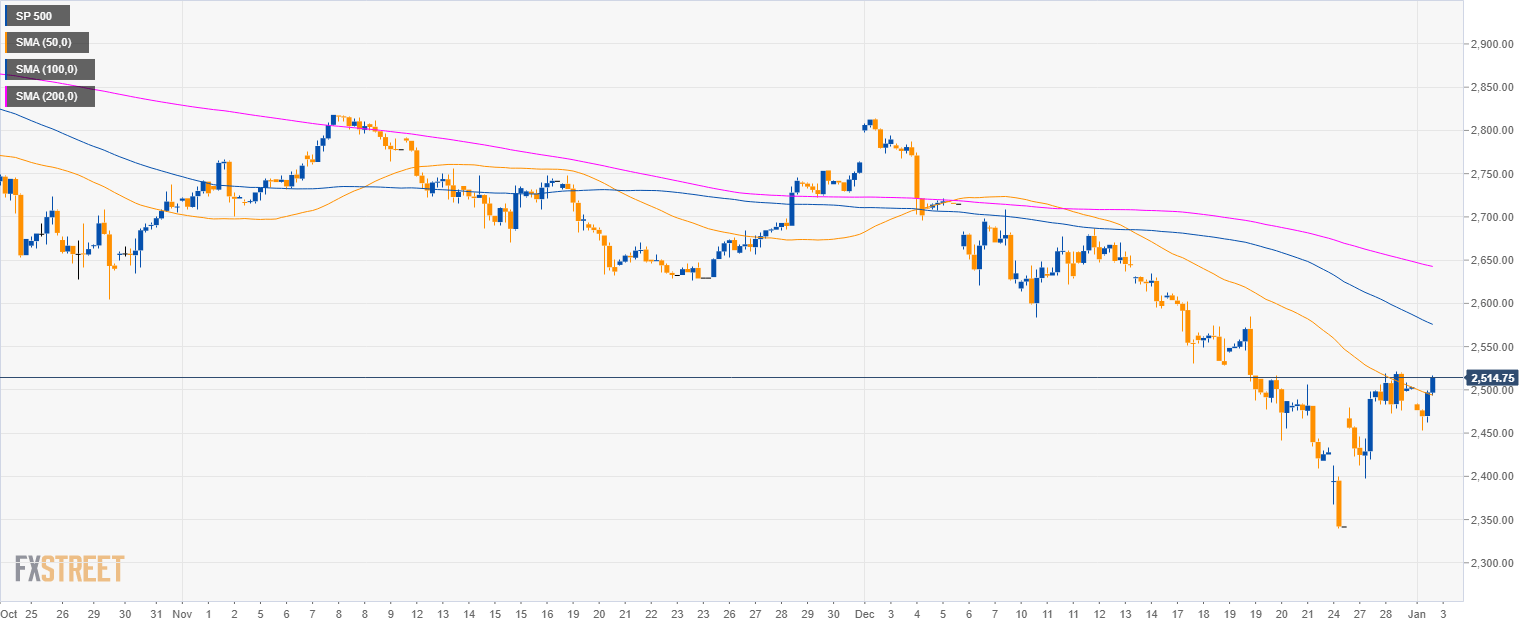
S&P500 4-hour chart
- Bulls are having a small Christmas rally since December 24, 2018.
- The market reclaimed the 2,500.00 round figure and the 50 SMA.
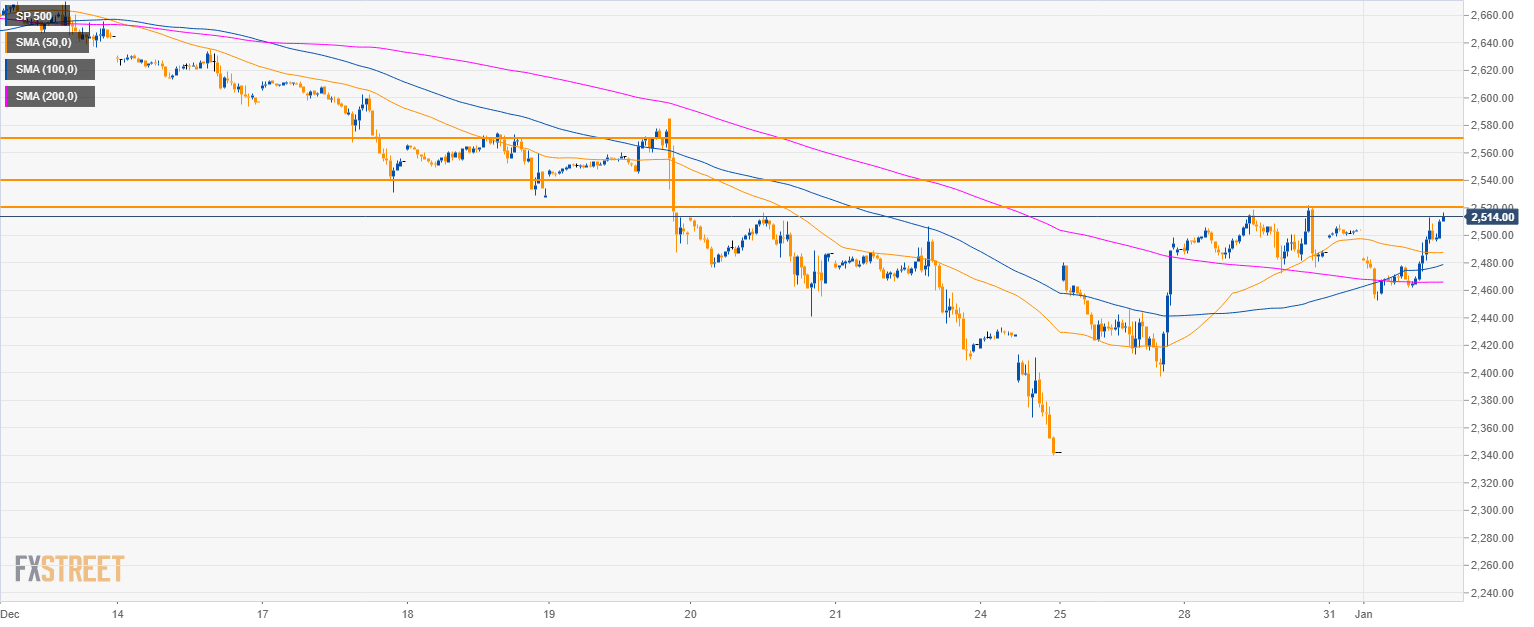
S&P500 30-minute chart
- The S&P500 is testing last week high and bulls will need to overcome the 2,520.00 and 2,540.00 resistances in order to extend gains towards 2,570.00 resistance.
Additional key levels
SP 500
Overview:
Today Last Price: 2514.25
Today Daily change: 1.1e+3 pips
Today Daily change %: 0.439%
Today Daily Open: 2503.25
Trends:
Previous Daily SMA20: 2567.82
Previous Daily SMA50: 2655.21
Previous Daily SMA100: 2763.41
Previous Daily SMA200: 2758.26
Levels:
Previous Daily High: 2508.25
Previous Daily Low: 2497.75
Previous Weekly High: 2521.75
Previous Weekly Low: 2340.25
Previous Monthly High: 2813.5
Previous Monthly Low: 2340.25
Previous Daily Fibonacci 38.2%: 2504.24
Previous Daily Fibonacci 61.8%: 2501.76
Previous Daily Pivot Point S1: 2497.92
Previous Daily Pivot Point S2: 2492.58
Previous Daily Pivot Point S3: 2487.42
Previous Daily Pivot Point R1: 2508.42
Previous Daily Pivot Point R2: 2513.58
Previous Daily Pivot Point R3: 2518.92
