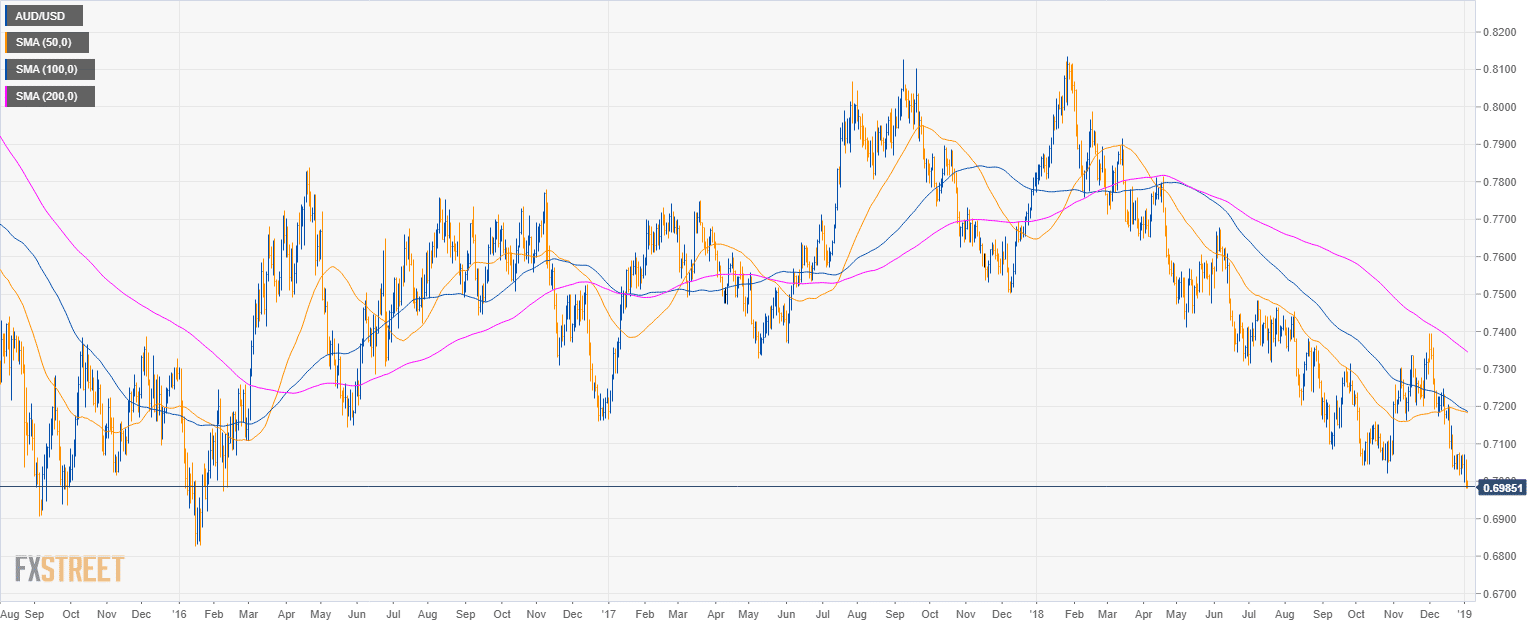
AUD/USD daily chart
- AUD/USD is trading in a bear trend below the 50 and 200-period simple moving average (SMA).
- AUD/USD is testing the 0.7000 figure, the lowest level in nearly three years.
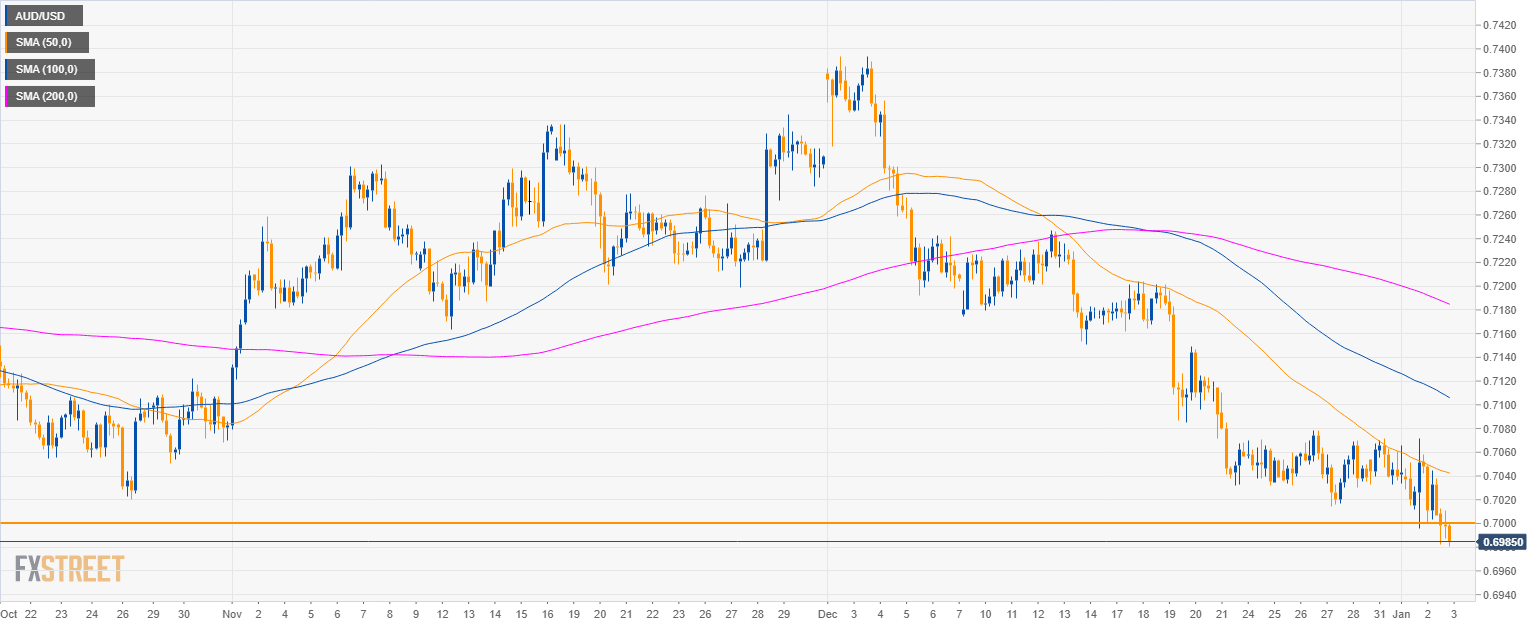
AUD/USD 4-hour chart
- AUD/USD rejected the 50 SMA.
- The bears need to keep AUD/USD below 0.7000 in order to extend the bear trend.
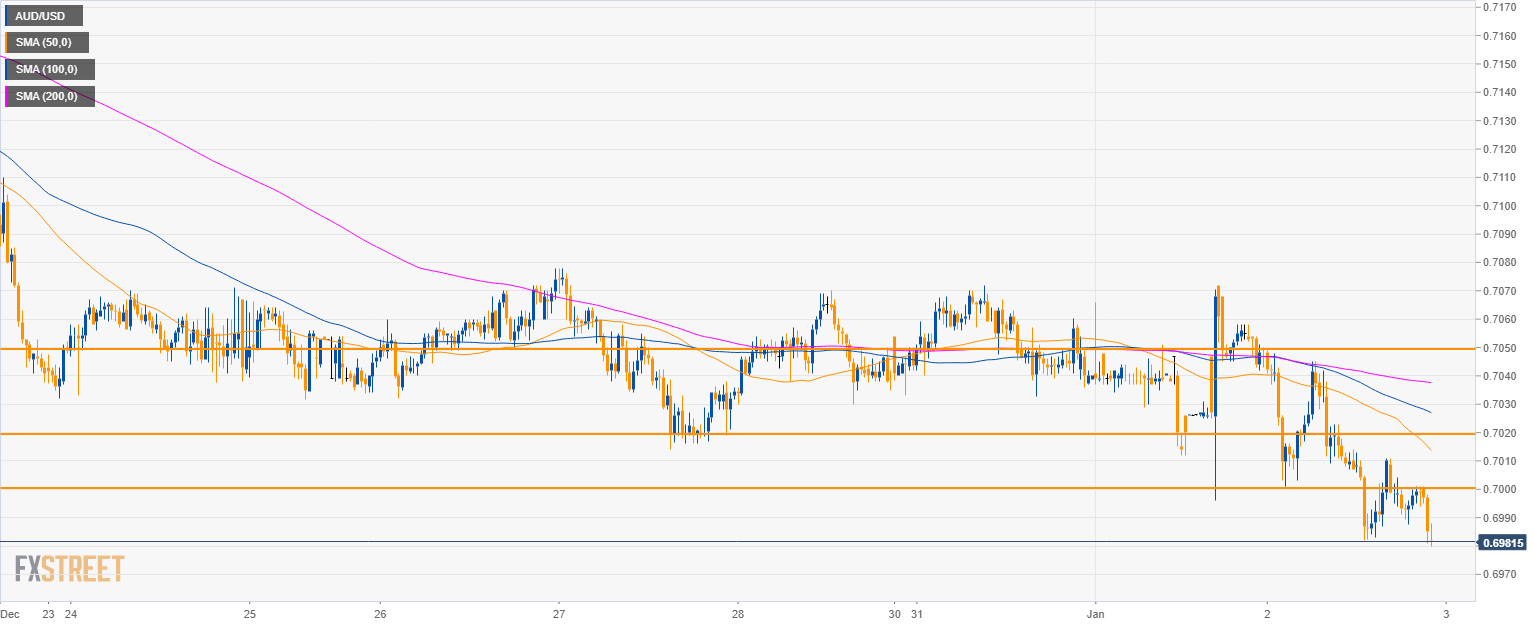
AUD/USD 30-minute chart
- Although the trend is strongly bearish the downside is very much likely limited as 0.7000, 0.7020 and 0.7050 become the next bull targets in the coming sessions.
Additional key levels:
AUD/USD
Overview:
Today Last Price: 0.6985
Today Daily change: -71 pips
Today Daily change %: -1.01%
Today Daily Open: 0.7056
Trends:
Previous Daily SMA20: 0.7134
Previous Daily SMA50: 0.7186
Previous Daily SMA100: 0.7192
Previous Daily SMA200: 0.7354
Levels:
Previous Daily High: 0.7072
Previous Daily Low: 0.6996
Previous Weekly High: 0.7078
Previous Weekly Low: 0.7014
Previous Monthly High: 0.7394
Previous Monthly Low: 0.7014
Previous Daily Fibonacci 38.2%: 0.7043
Previous Daily Fibonacci 61.8%: 0.7025
Previous Daily Pivot Point S1: 0.7011
Previous Daily Pivot Point S2: 0.6965
Previous Daily Pivot Point S3: 0.6935
Previous Daily Pivot Point R1: 0.7087
Previous Daily Pivot Point R2: 0.7117
Previous Daily Pivot Point R3: 0.7163
