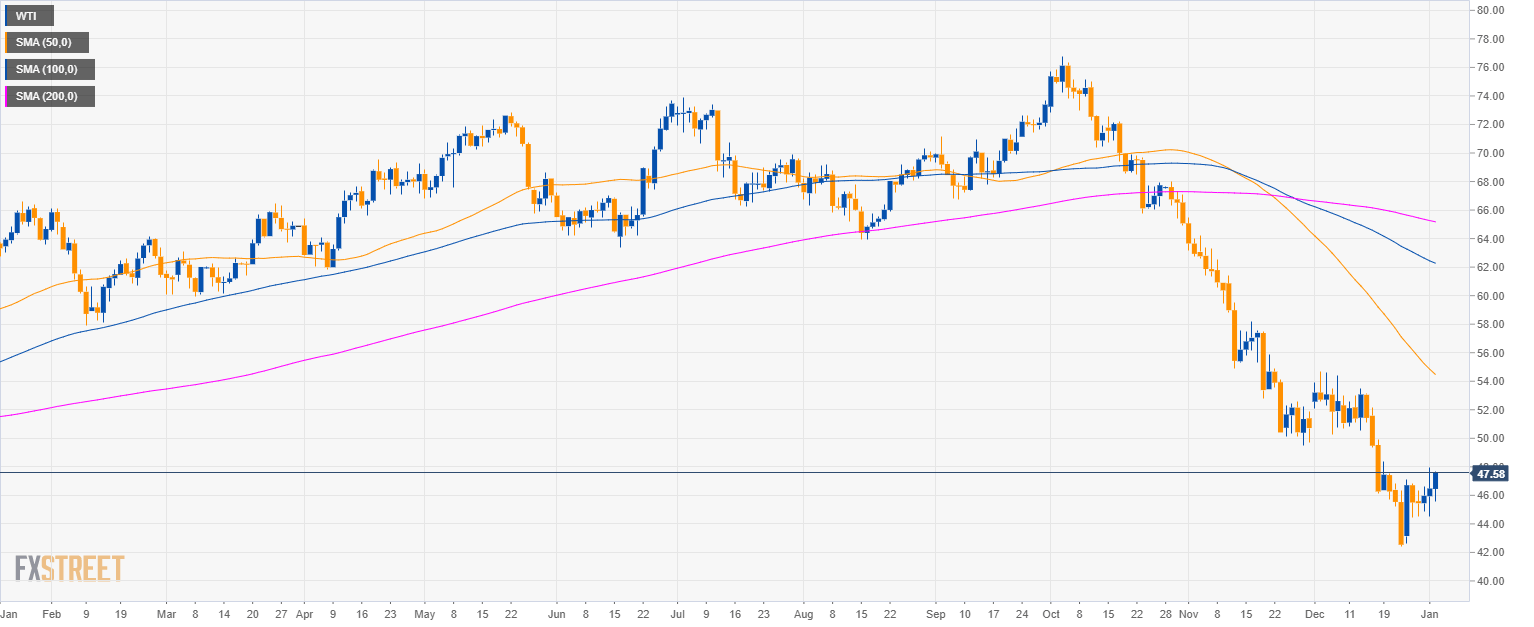
Oil daily chart
- Crude oil WTI is trading in a bear trend below the 200-period simple moving average (SMA).
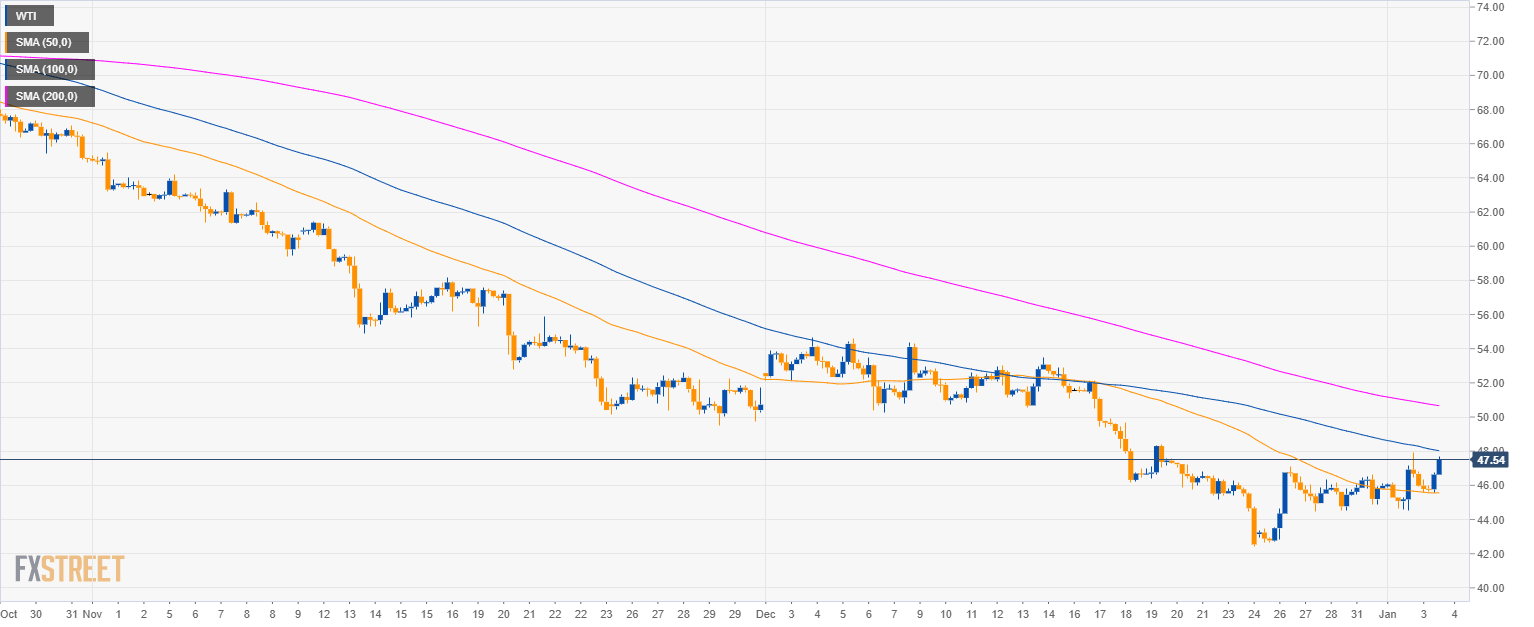
Oil 4-hour chart
- Bulls want to test the 48.00 figure and the 100 SMA.
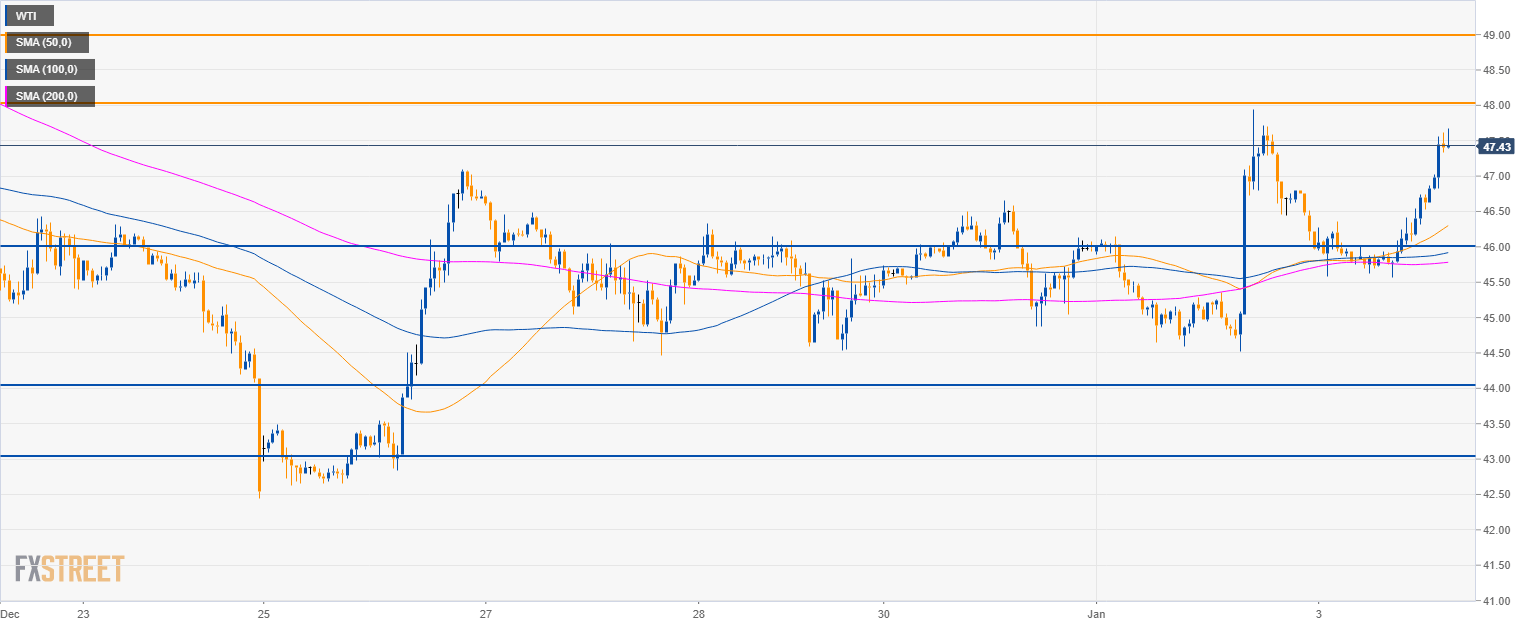
Oil 30-minute chart
- WTI is trading above its main SMAs. The current momentum is bullish and the level to beat for bulls is the 48.00 figure.
- A break above 48.00 can lead to a continuation up to $49.00 a barrel.
- To the downside, support is seen at the 46.00 and 44.00 levels.
Additional key levels
WTI
Overview:
Today Last Price: 47.52
Today Daily change: 1.0e+2 pips
Today Daily change %: 2.24%
Today Daily Open: 46.48
Trends:
Previous Daily SMA20: 48.76
Previous Daily SMA50: 53.46
Previous Daily SMA100: 62
Previous Daily SMA200: 65.42
Levels:
Previous Daily High: 47.94
Previous Daily Low: 44.52
Previous Weekly High: 47.09
Previous Weekly Low: 42.45
Previous Monthly High: 54.68
Previous Monthly Low: 42.45
Previous Daily Fibonacci 38.2%: 46.63
Previous Daily Fibonacci 61.8%: 45.83
Previous Daily Pivot Point S1: 44.69
Previous Daily Pivot Point S2: 42.89
Previous Daily Pivot Point S3: 41.27
Previous Daily Pivot Point R1: 48.11
Previous Daily Pivot Point R2: 49.73
Previous Daily Pivot Point R3: 51.53
