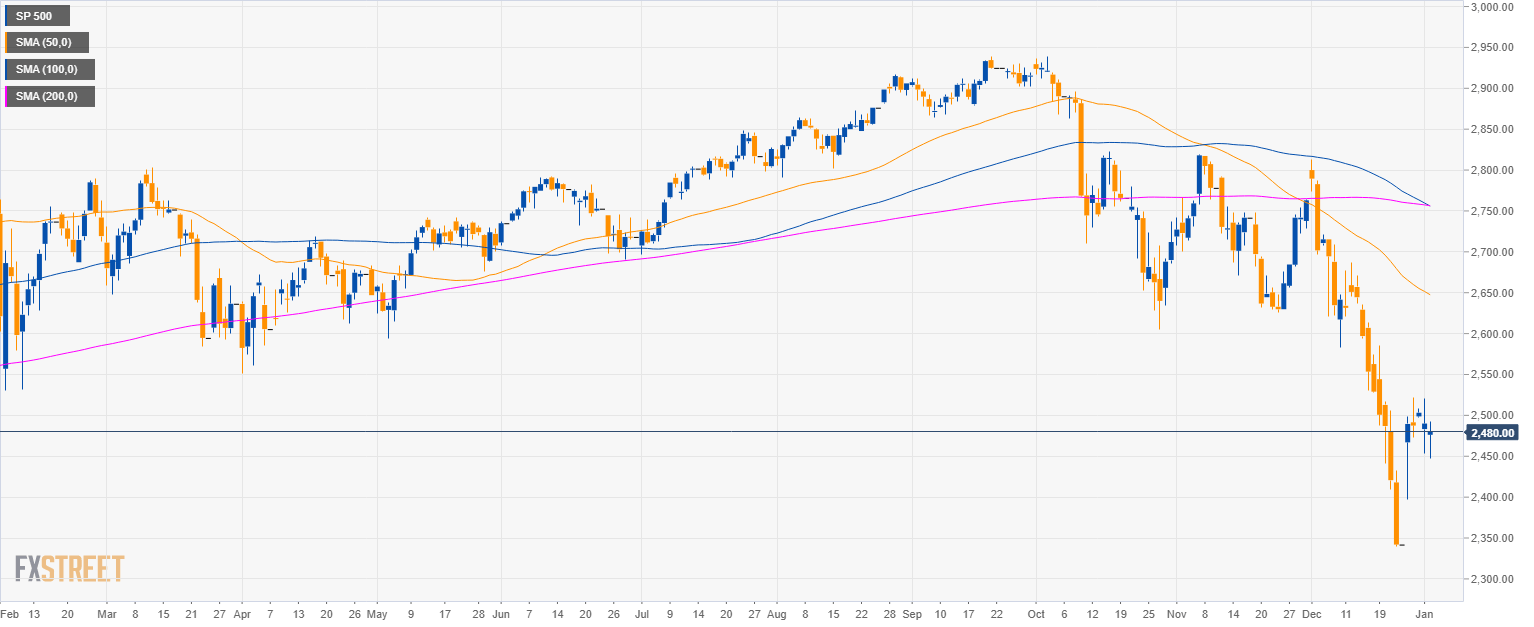
S&P500 daily chart
- The S&P500 is having a deep pullback below the 50, 100 and 200-period simple moving averages (SMAs).
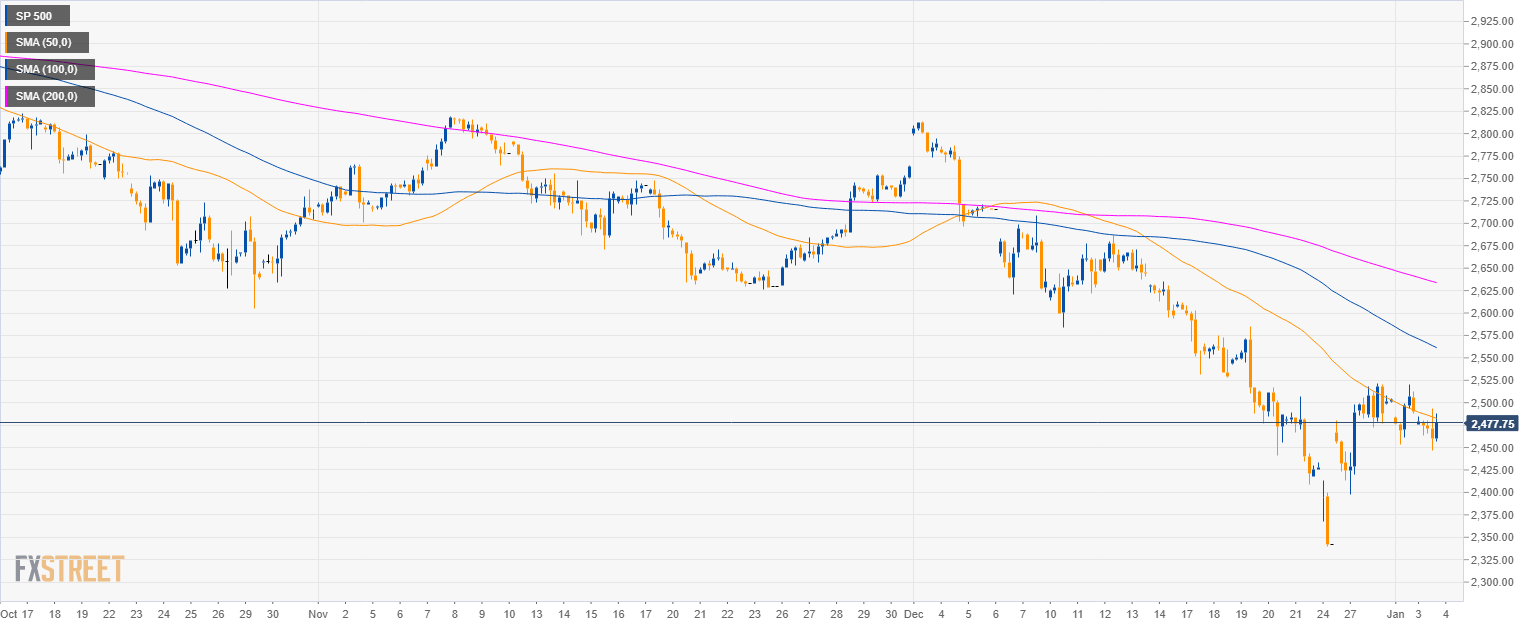
S&P500 4-hour chart
- Bulls are having a small Christmas rally since December 24, 2018 but there is little bullish follow-through.
- The market needs to reclaim the 50 SMA for further gains or else big bears might come back.
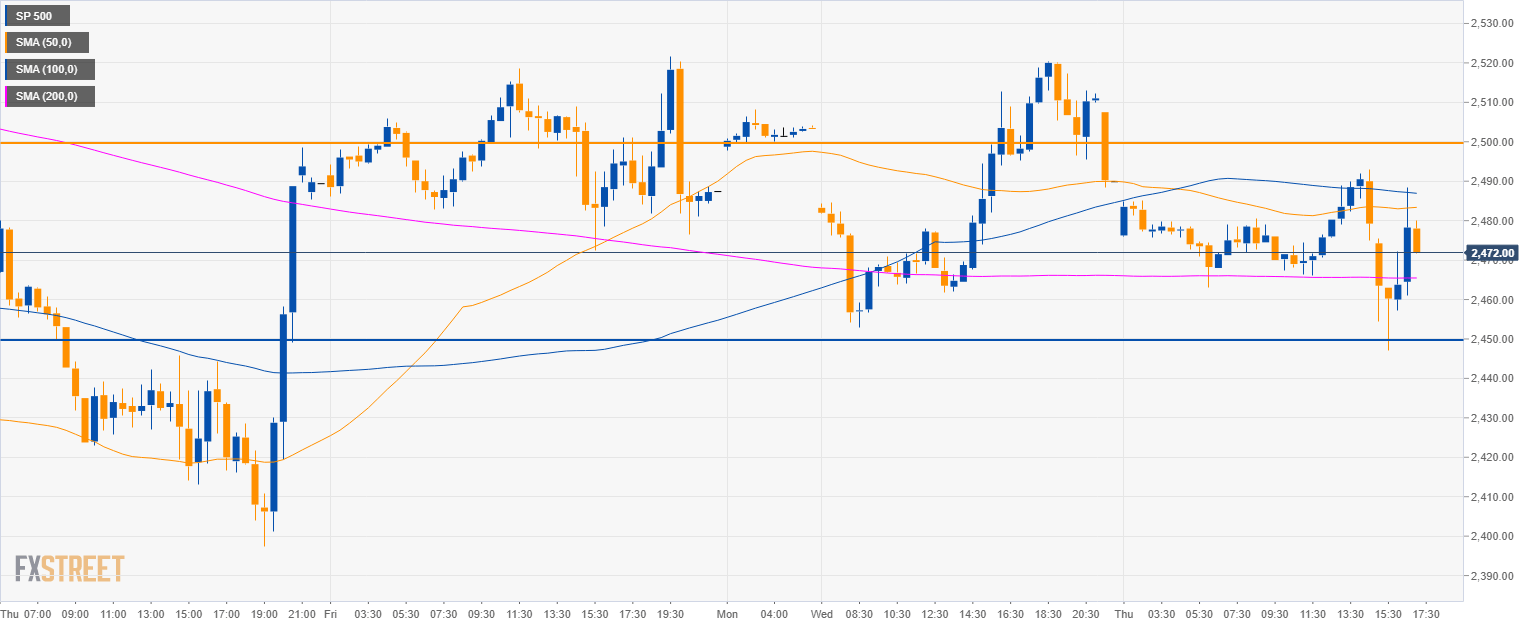
S&P500 30-minute chart
- The S&P500 is in a tight range.
- Bulls will need to overcome the 2,500.00 and 2,540.00 resistances in order to extend gains towards 2,570.00 resistance.
- On the flip side, bears would need a break below the 2,450.00 level to extend losses.
Additional key levels
SP 500
Overview:
Today Last Price: 2478.25
Today Daily change: -1.2e+3 pips
Today Daily change %: -0.472%
Today Daily Open: 2490
Trends:
Previous Daily SMA20: 2552.85
Previous Daily SMA50: 2651.52
Previous Daily SMA100: 2759.7
Previous Daily SMA200: 2757.42
Levels:
Previous Daily High: 2520.25
Previous Daily Low: 2453
Previous Weekly High: 2521.75
Previous Weekly Low: 2340.25
Previous Monthly High: 2813.5
Previous Monthly Low: 2340.25
Previous Daily Fibonacci 38.2%: 2494.56
Previous Daily Fibonacci 61.8%: 2478.69
Previous Daily Pivot Point S1: 2455.25
Previous Daily Pivot Point S2: 2420.5
Previous Daily Pivot Point S3: 2388
Previous Daily Pivot Point R1: 2522.5
Previous Daily Pivot Point R2: 2555
Previous Daily Pivot Point R3: 2589.75
