- After jaunts up and down the charts, GBP/USD finds itself trading the week roughly back where it started, near 1.2650.
GBP/USD, 15-Minute
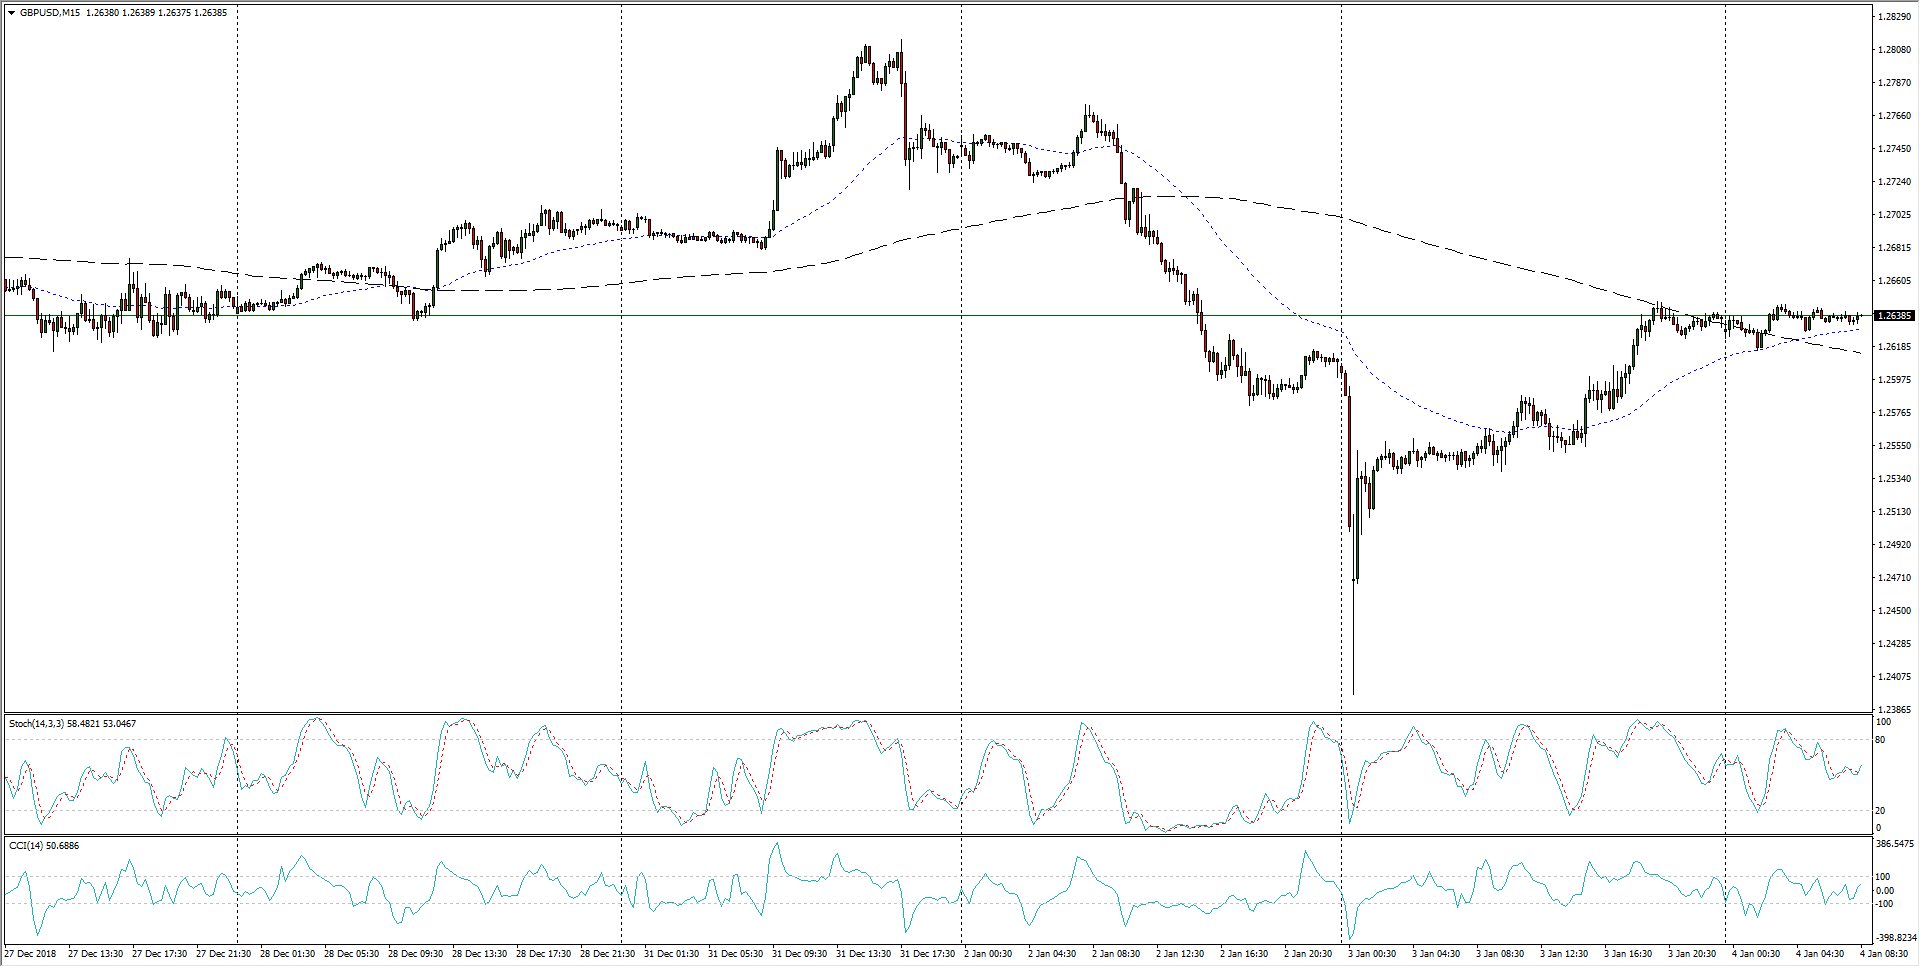
- December has been hall-marked by consolidation for the Cable, broken up by frequent whipsaws that tend to go nowhere over time, leaving the major pair biased towards the middle.
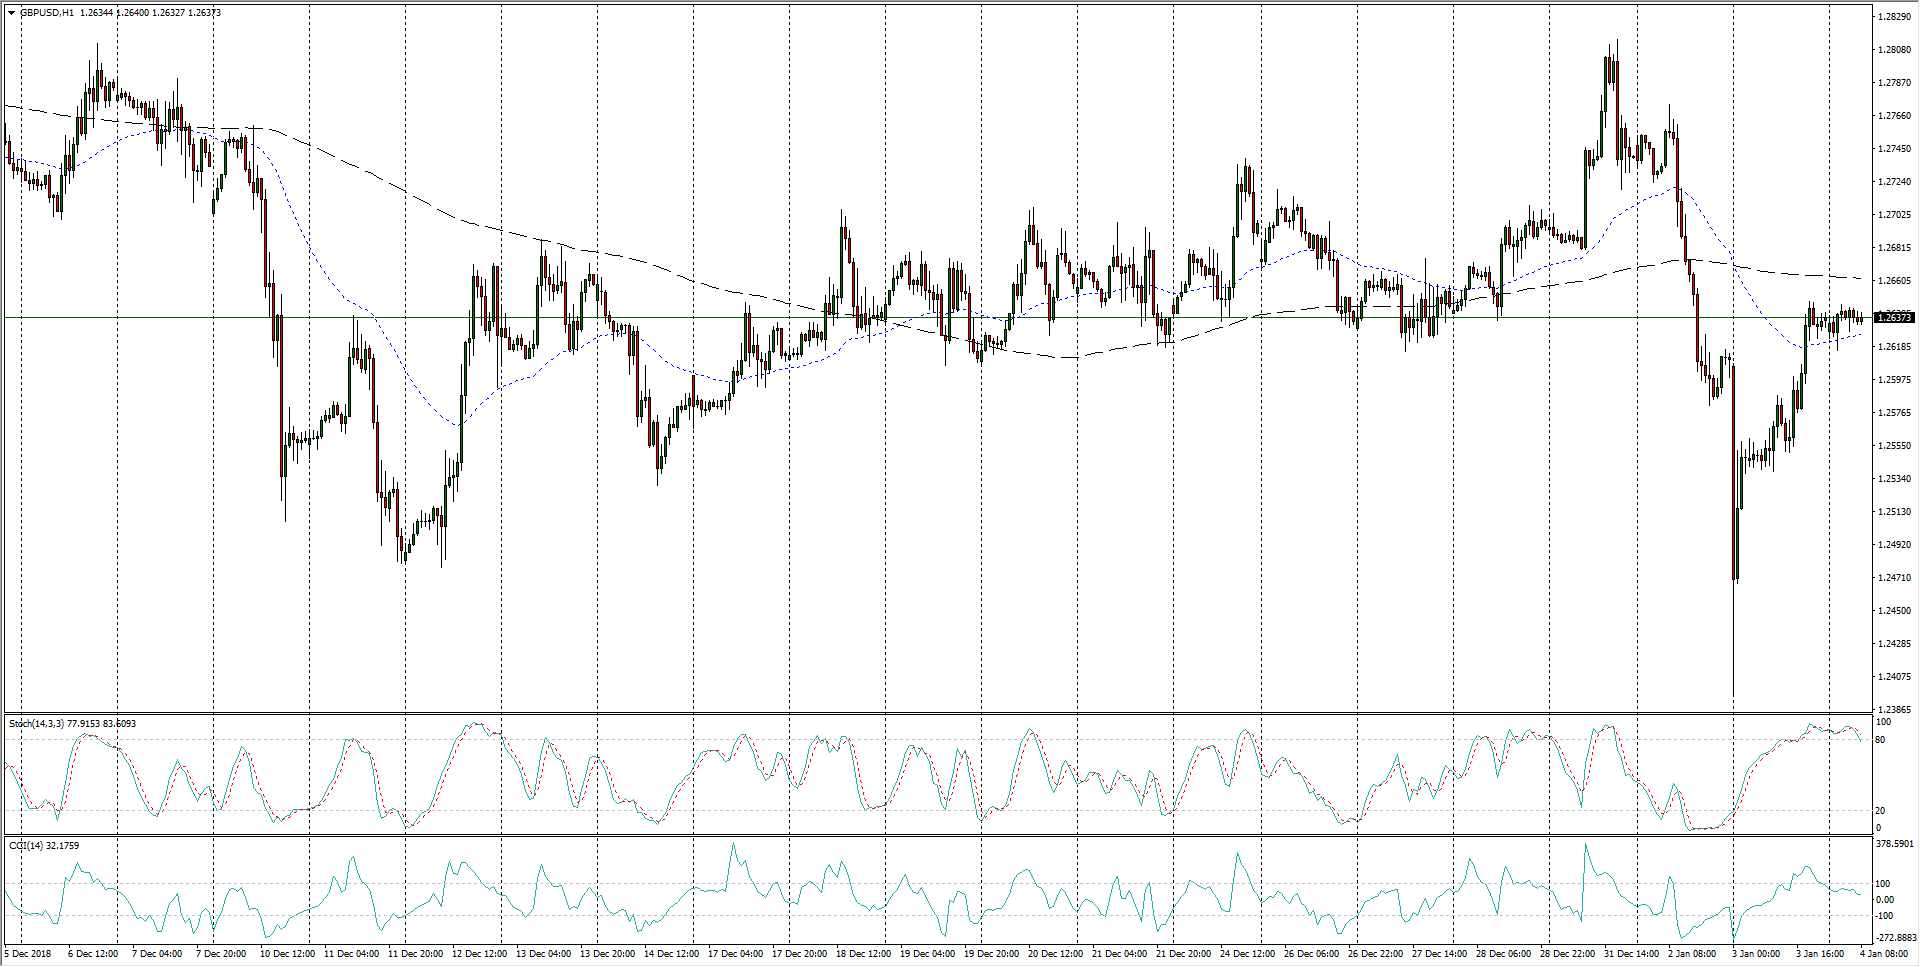
GBP/USD, 1-Hour
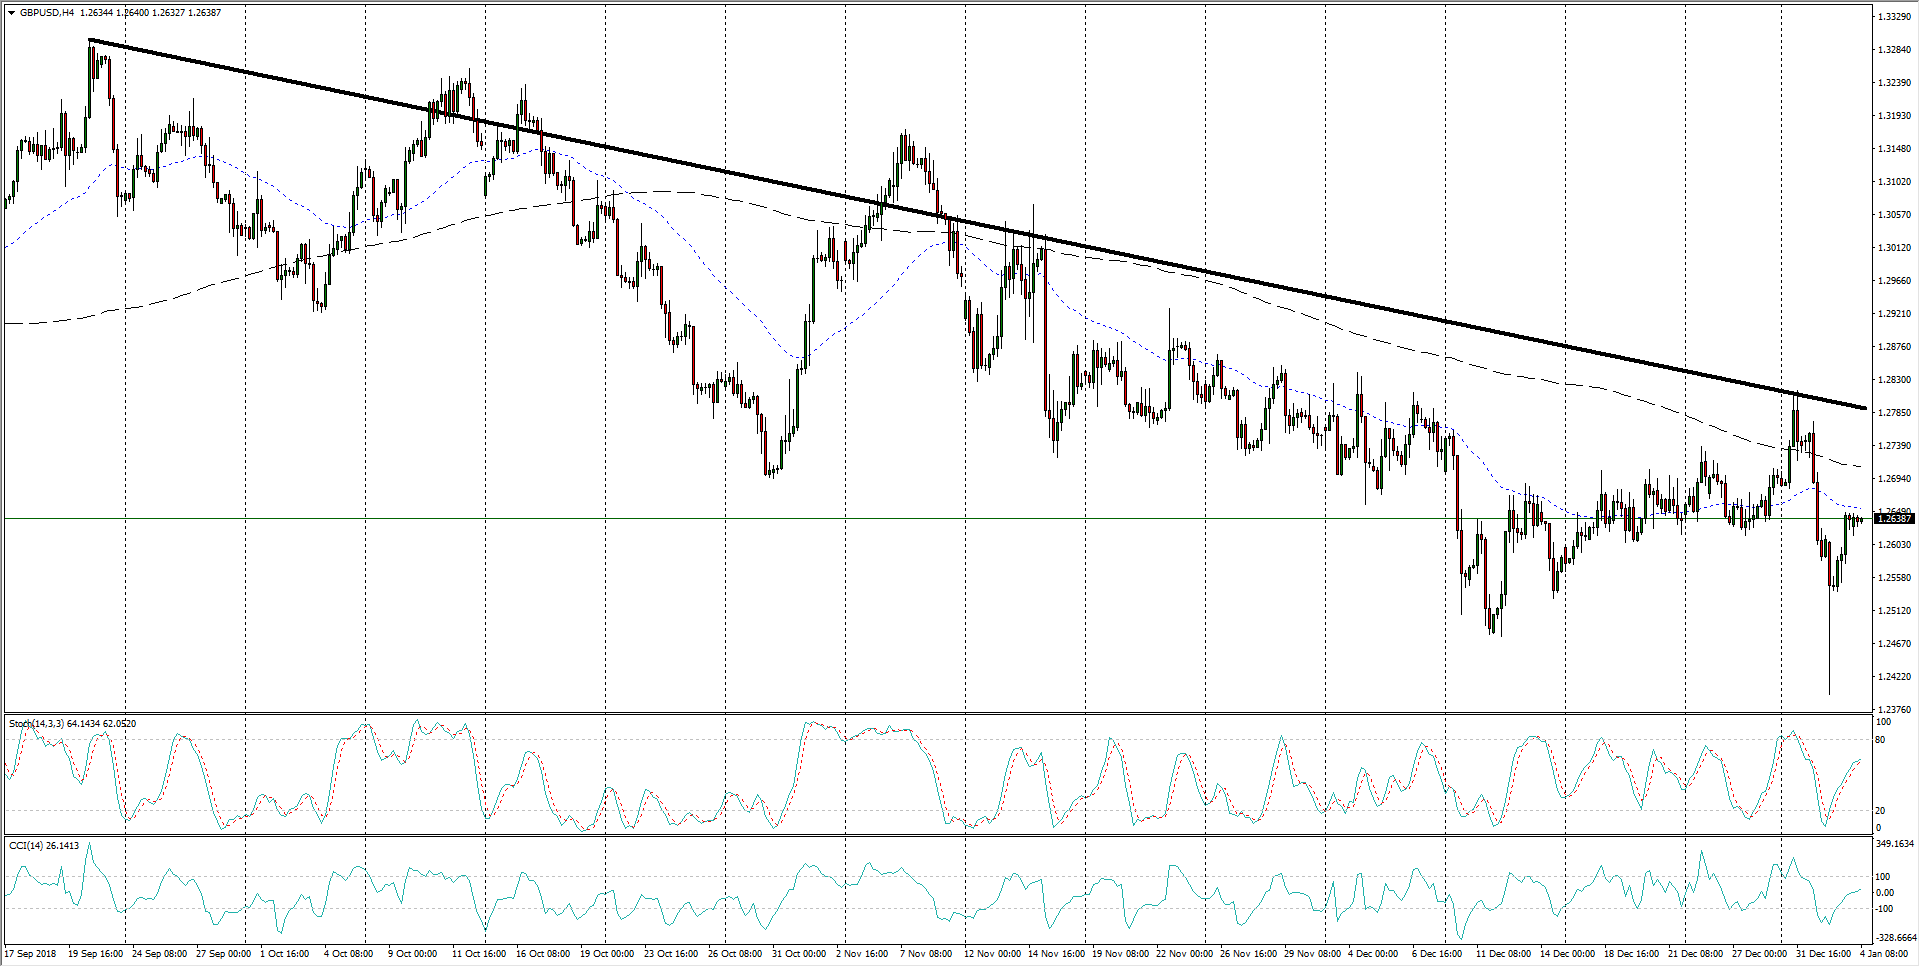
- The previous quarter shows GBP/USD in a firm downtrend, likely due to continuous bearish pressure from Brexit proceedings, and although the last couple of swing lows could be supporting a medium-term bullish reversal, traders will be waiting for a decisive break of levels beyond 1.2700 before hopping into any major bidding positions.
GBP/USD, 4-Hour
GBP/USD
Overview:
Today Last Price: 1.2636
Today Daily change: 1.0 pips
Today Daily change %: 0.00791%
Today Daily Open: 1.2635
Trends:
Previous Daily SMA20: 1.265
Previous Daily SMA50: 1.2775
Previous Daily SMA100: 1.2898
Previous Daily SMA200: 1.3162
Levels:
Previous Daily High: 1.2648
Previous Daily Low: 1.2438
Previous Weekly High: 1.2778
Previous Weekly Low: 1.2616
Previous Monthly High: 1.284
Previous Monthly Low: 1.2477
Previous Daily Fibonacci 38.2%: 1.2568
Previous Daily Fibonacci 61.8%: 1.2518
Previous Daily Pivot Point S1: 1.2499
Previous Daily Pivot Point S2: 1.2363
Previous Daily Pivot Point S3: 1.2289
Previous Daily Pivot Point R1: 1.271
Previous Daily Pivot Point R2: 1.2784
Previous Daily Pivot Point R3: 1.292
