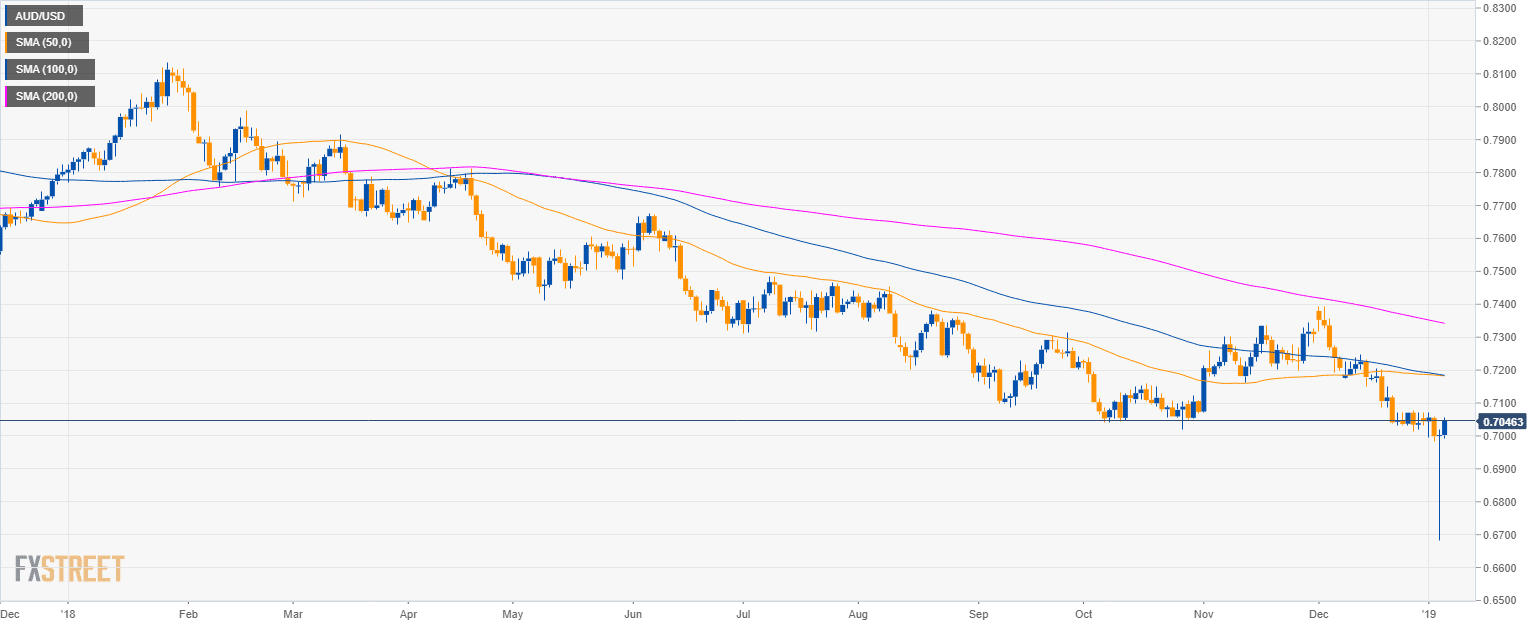
AUD/USD daily chart
- AUD/USD is trading in a bear trend below the 200-period simple moving average (SMA).
- The Aussie is trading near 3-year’s low.
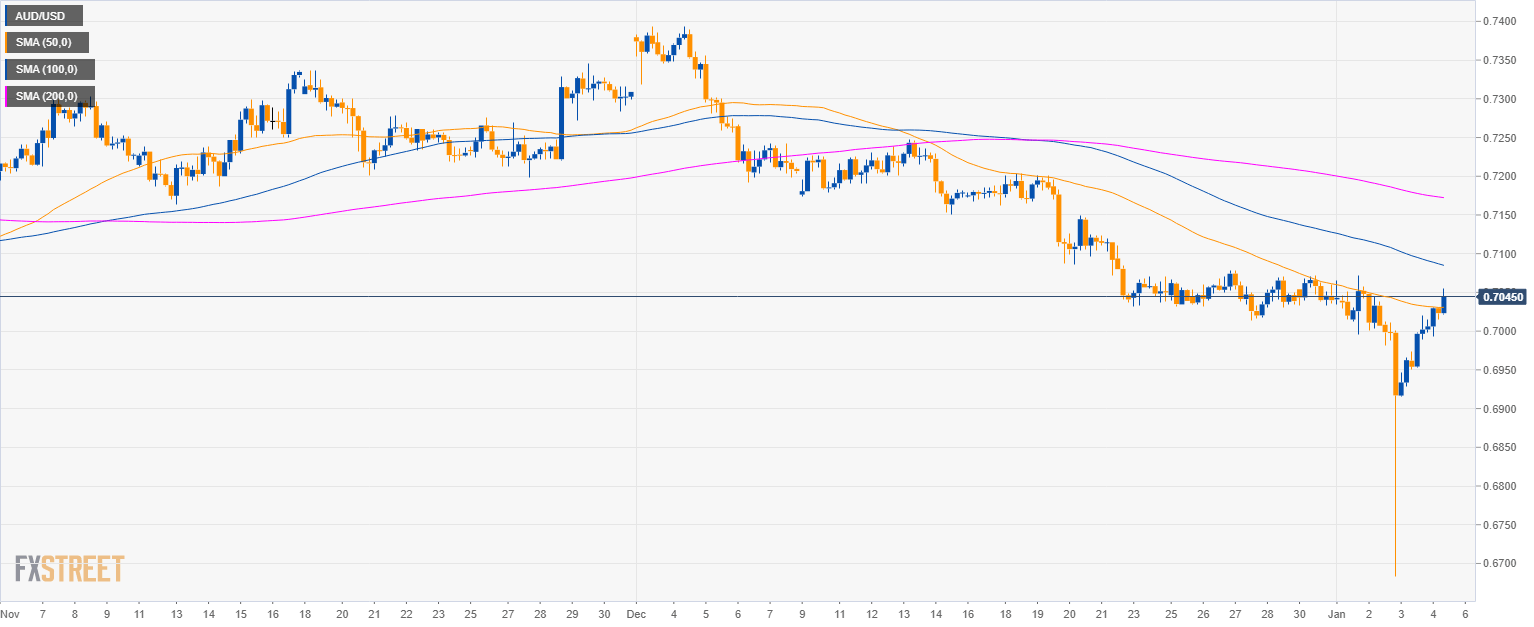
AUD/USD 4-hour chart
- AUD/USD is challenging the 50 SMA.
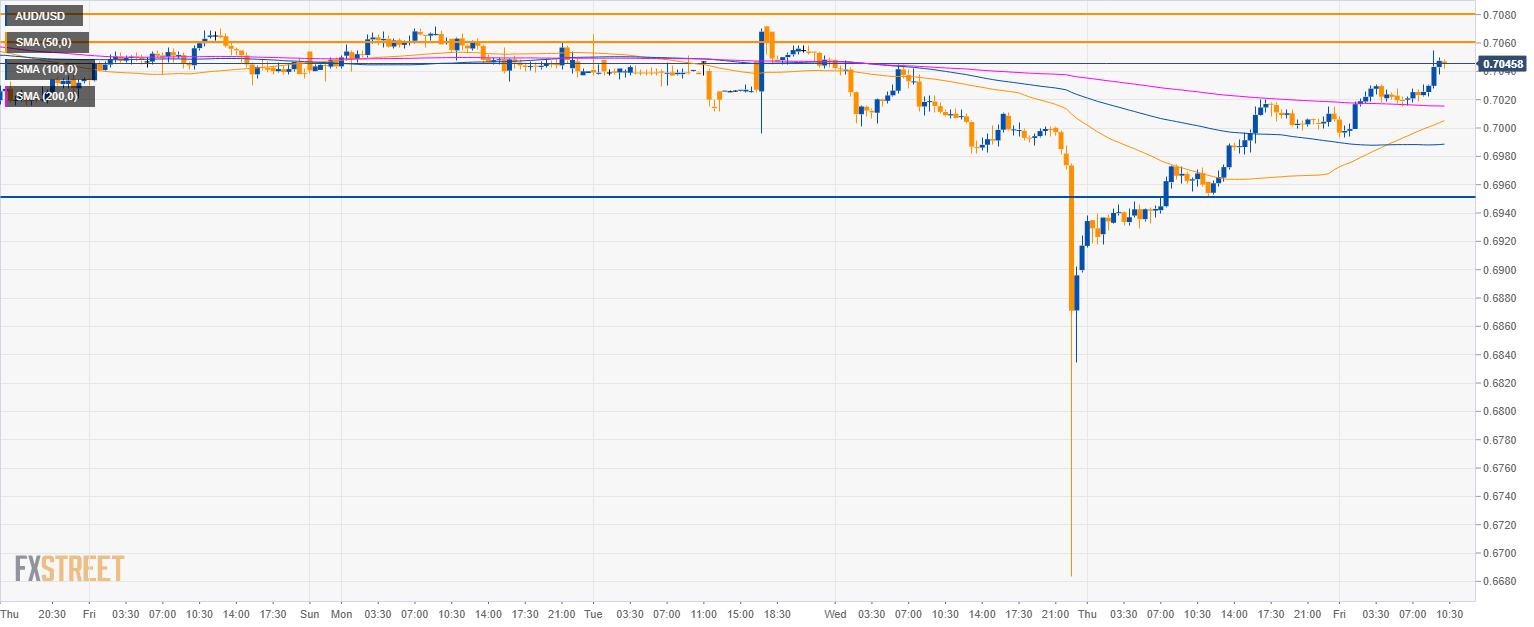
AUD/USD 30-minute chart
- 0.7060 and 0.7080 are likely going to act as resistance.
- Since the main trend is bearish a retest of 0.6950 to the downside can be on the cards.
Additional key levels
AUD/USD
Overview:
Today Last Price: 0.7046
Today Daily change: 44 pips
Today Daily change %: 0.628%
Today Daily Open: 0.7002
Trends:
Previous Daily SMA20: 0.7108
Previous Daily SMA50: 0.7184
Previous Daily SMA100: 0.7187
Previous Daily SMA200: 0.7346
Levels:
Previous Daily High: 0.702
Previous Daily Low: 0.6684
Previous Weekly High: 0.7078
Previous Weekly Low: 0.7014
Previous Monthly High: 0.7394
Previous Monthly Low: 0.7014
Previous Daily Fibonacci 38.2%: 0.6892
Previous Daily Fibonacci 61.8%: 0.6812
Previous Daily Pivot Point S1: 0.6784
Previous Daily Pivot Point S2: 0.6566
Previous Daily Pivot Point S3: 0.6448
Previous Daily Pivot Point R1: 0.712
Previous Daily Pivot Point R2: 0.7238
Previous Daily Pivot Point R3: 0.7457
