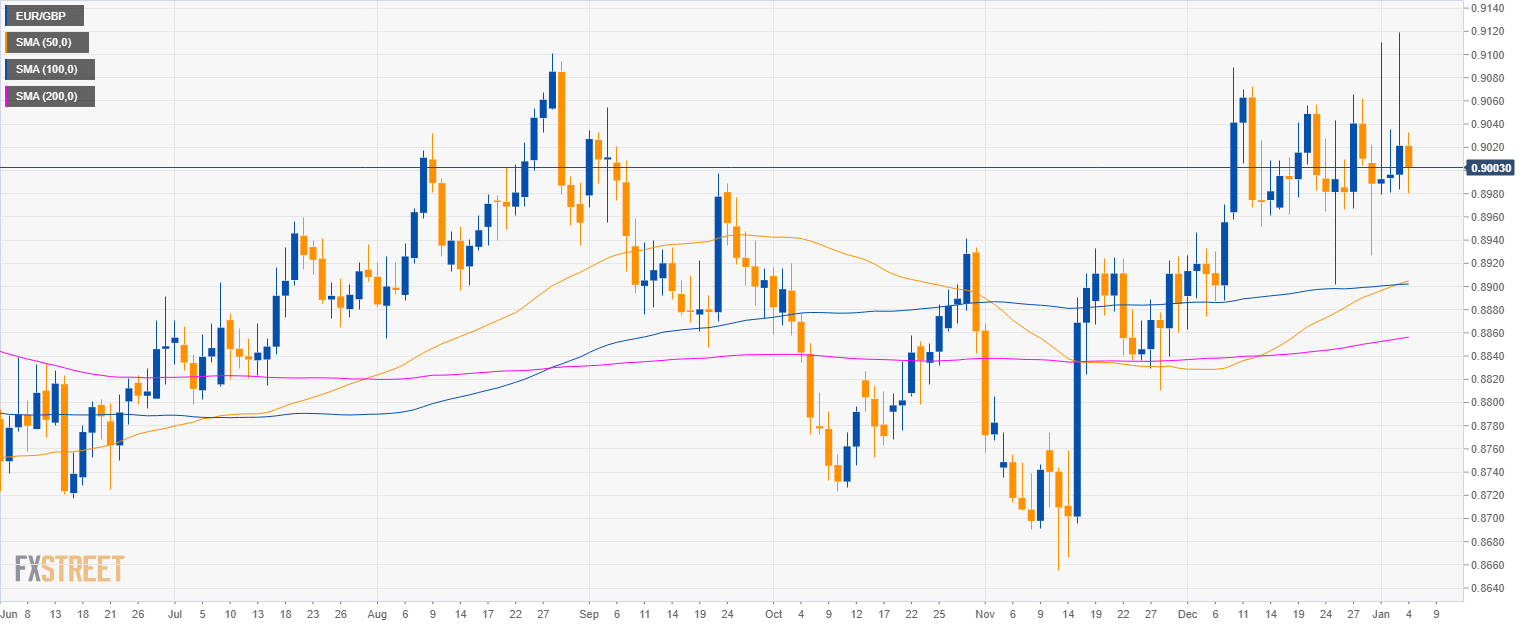
EUR/GBP daily chart
- EUR/GBP is trading in a sideways trend above the 200-period simple moving average (SMA).
- The market has been predominantly choppy since December 2018.
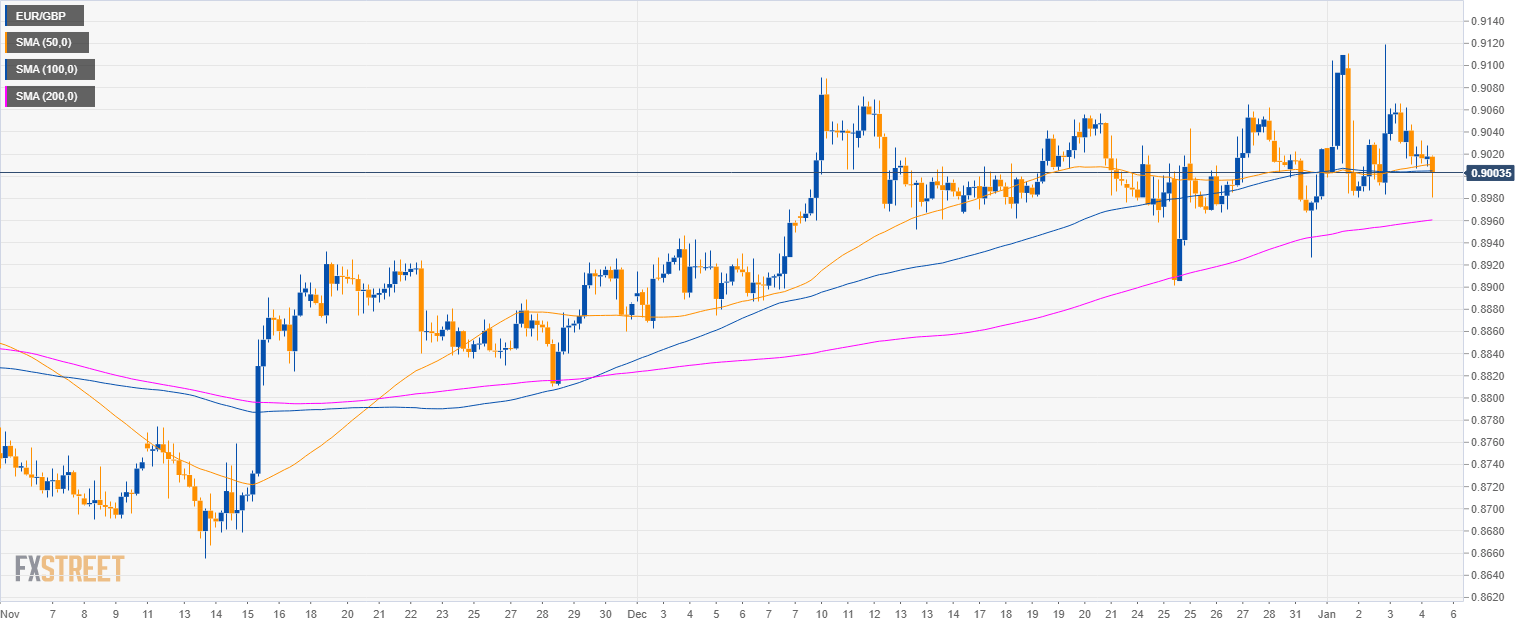
EUR/GBP 4-hour chart
- EUR/GBP is trading above the 200 SMA suggesting that the current momentum is bullish.
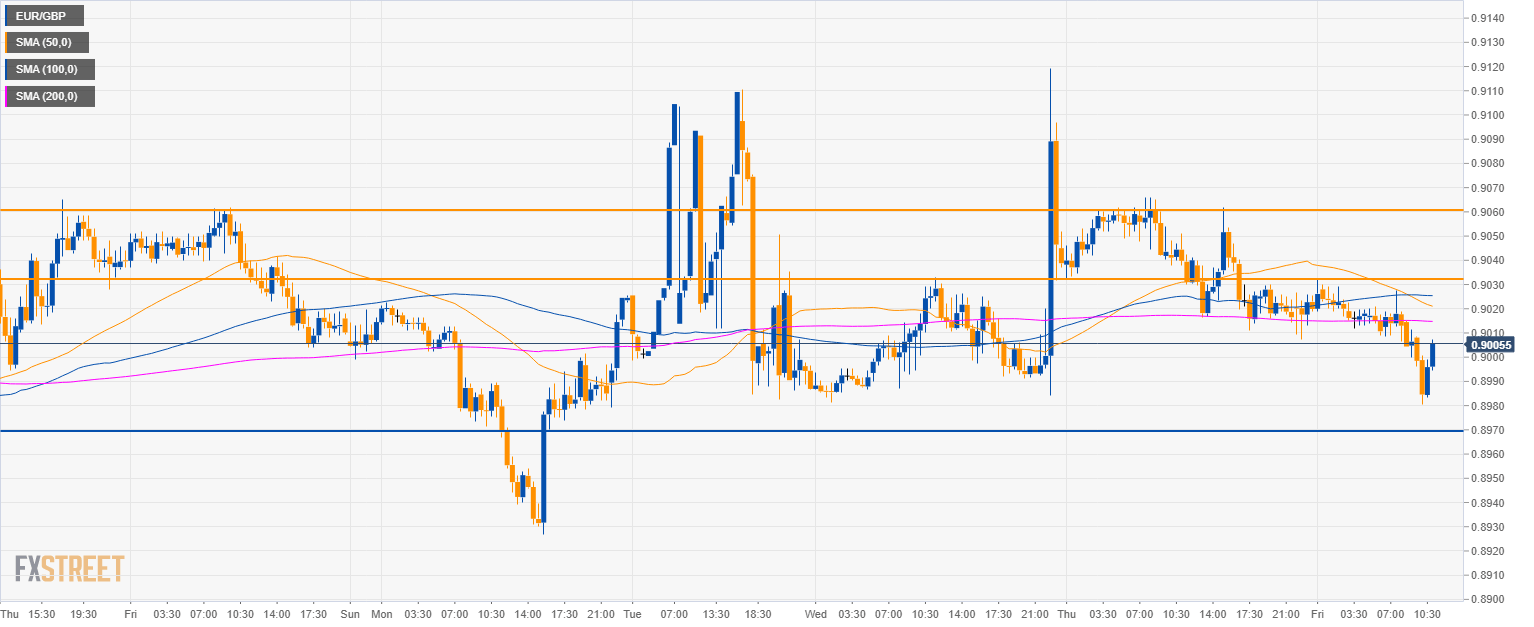
EUR/GBP 30-minute chart
- EUR/GBP is trading near the 0.9000 figure. Bulls will try to lift the market to 0.9033 and then 0.9060 if they gather enough steam.
- On the flip side, support is seen at the 0.8970 level.
Additional key levels
EUR/GBP
Overview:
Today Last Price: 0.9004
Today Daily change: -17 pips
Today Daily change %: -0.188%
Today Daily Open: 0.9021
Trends:
Previous Daily SMA20: 0.9002
Previous Daily SMA50: 0.8903
Previous Daily SMA100: 0.8902
Previous Daily SMA200: 0.8855
Levels:
Previous Daily High: 0.9119
Previous Daily Low: 0.8984
Previous Weekly High: 0.9065
Previous Weekly Low: 0.8902
Previous Monthly High: 0.9089
Previous Monthly Low: 0.8863
Previous Daily Fibonacci 38.2%: 0.9068
Previous Daily Fibonacci 61.8%: 0.9036
Previous Daily Pivot Point S1: 0.8964
Previous Daily Pivot Point S2: 0.8906
Previous Daily Pivot Point S3: 0.8828
Previous Daily Pivot Point R1: 0.9099
Previous Daily Pivot Point R2: 0.9177
Previous Daily Pivot Point R3: 0.9235
