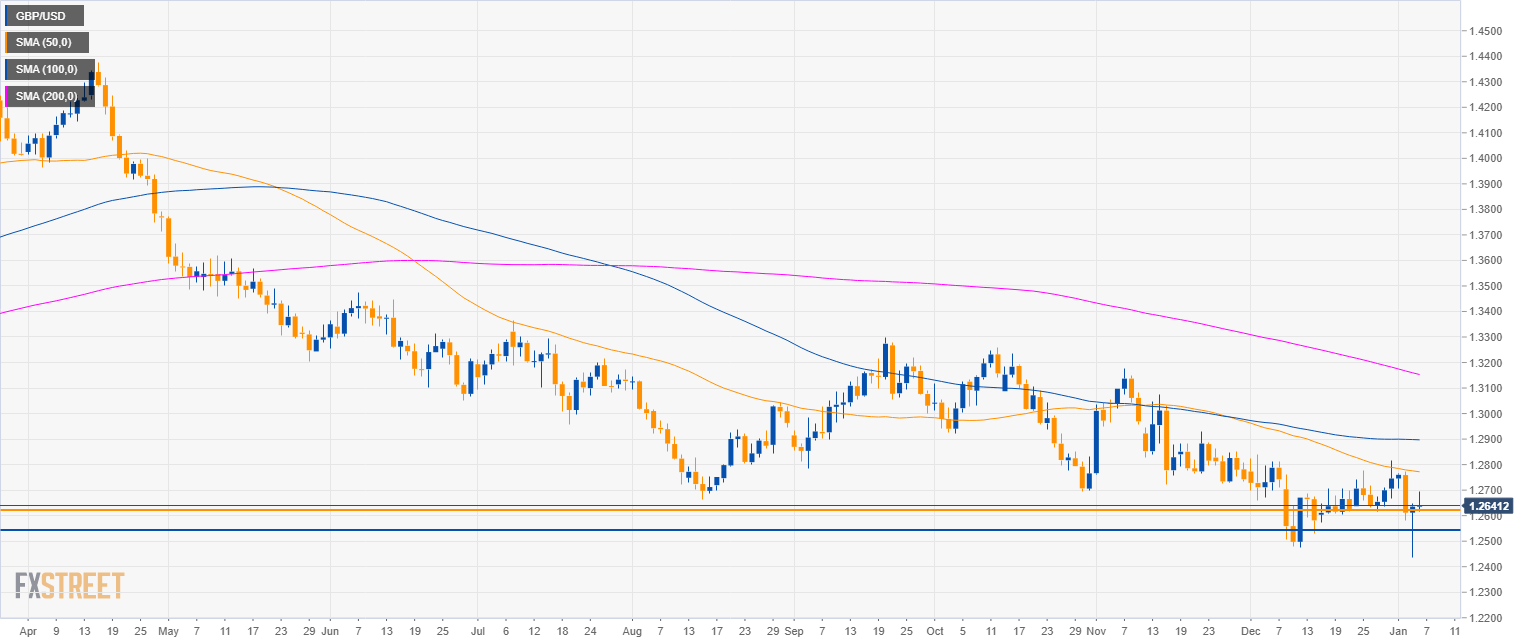
GBP/USD daily chart
- GBP/USD is trading in a bear trend below the 200-period simple moving average (SMA).
- The US nonfarm payrolls (NFP) came in above market forecast at 312K vs. 177K which is potentially bullish for the US Dollar.
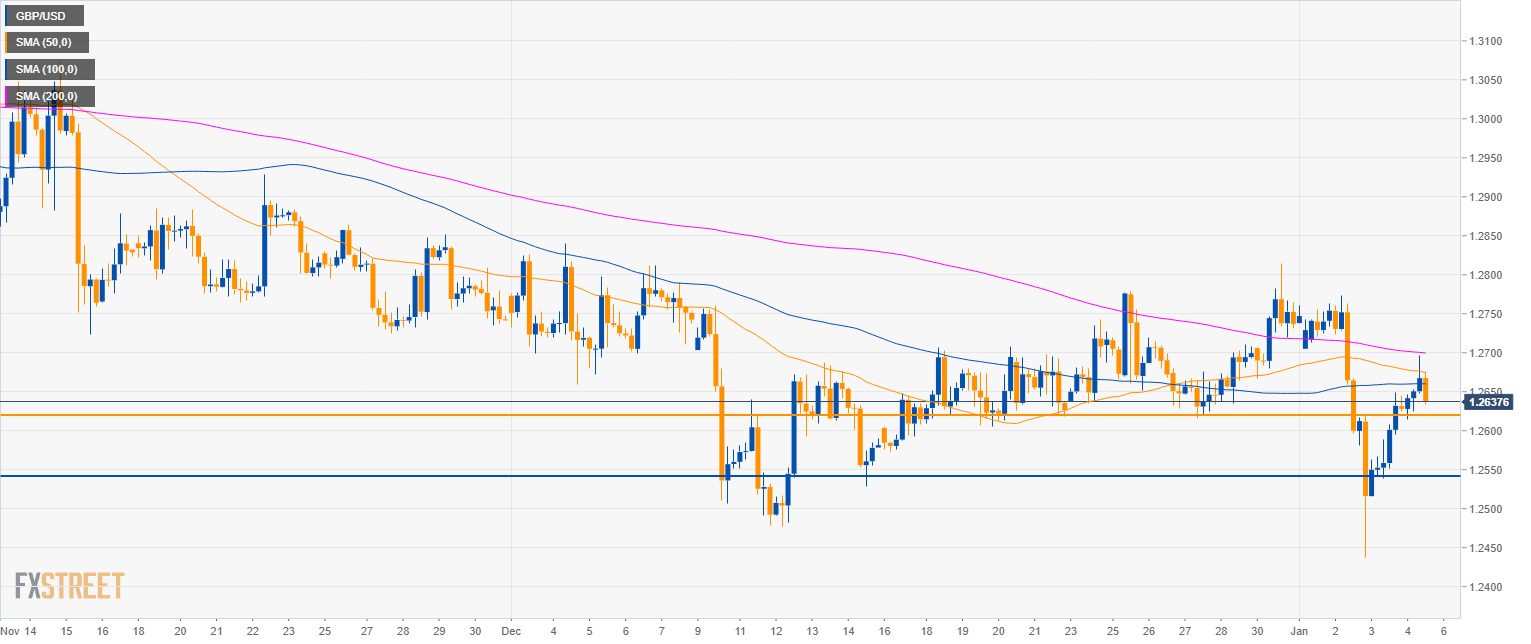
GBP/USD 4-hour chart
- GBP/USD is currently rejecting the 50 and 100 SMAs.
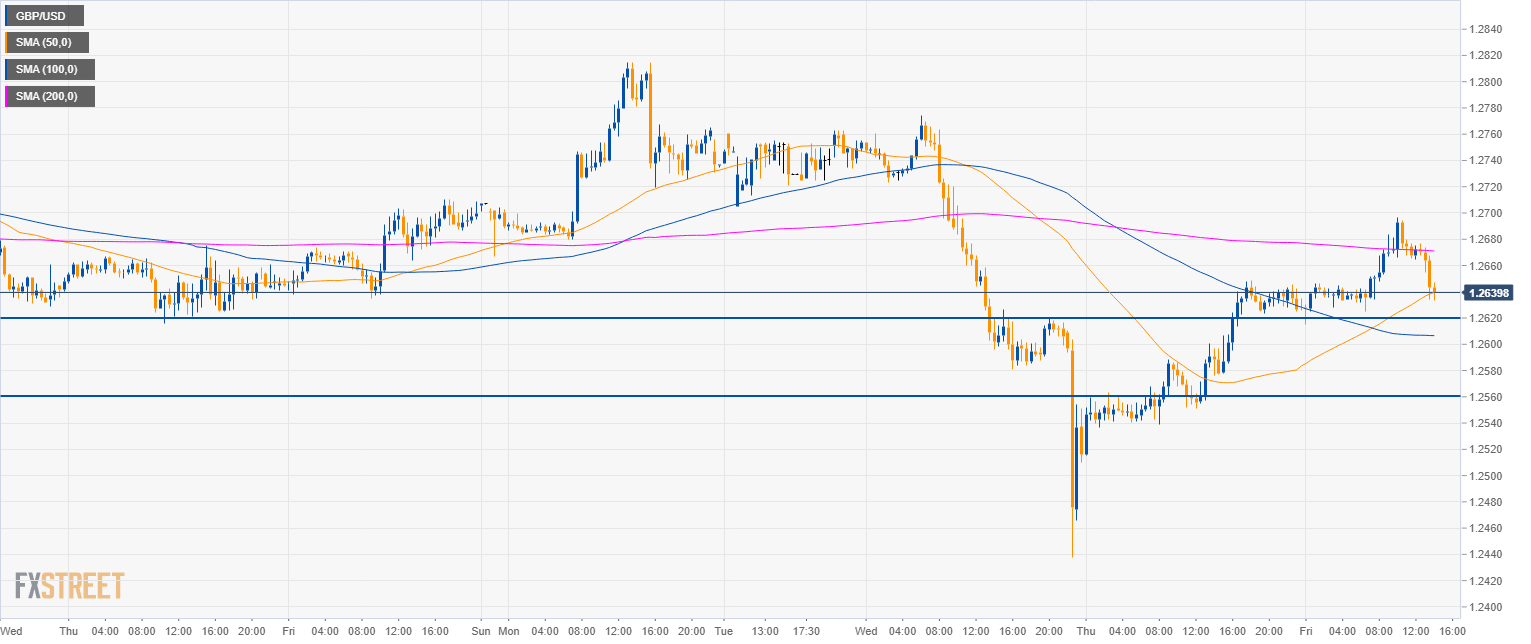
GBP/USD 30-minute chart
- GBP/USD is currently capped by the 200 SMA.
- GBP/USD rejected the 100 SMA and 1.2620 and 1.2560 are seen as potential bear targets.
Additional key levels
GBP/USD
Overview:
Today Last Price: 1.2644
Today Daily change: 9.0 pips
Today Daily change %: 0.0712%
Today Daily Open: 1.2635
Trends:
Previous Daily SMA20: 1.265
Previous Daily SMA50: 1.2775
Previous Daily SMA100: 1.2898
Previous Daily SMA200: 1.3162
Levels:
Previous Daily High: 1.2648
Previous Daily Low: 1.2438
Previous Weekly High: 1.2778
Previous Weekly Low: 1.2616
Previous Monthly High: 1.284
Previous Monthly Low: 1.2477
Previous Daily Fibonacci 38.2%: 1.2568
Previous Daily Fibonacci 61.8%: 1.2518
Previous Daily Pivot Point S1: 1.2499
Previous Daily Pivot Point S2: 1.2363
Previous Daily Pivot Point S3: 1.2289
Previous Daily Pivot Point R1: 1.271
Previous Daily Pivot Point R2: 1.2784
Previous Daily Pivot Point R3: 1.292
