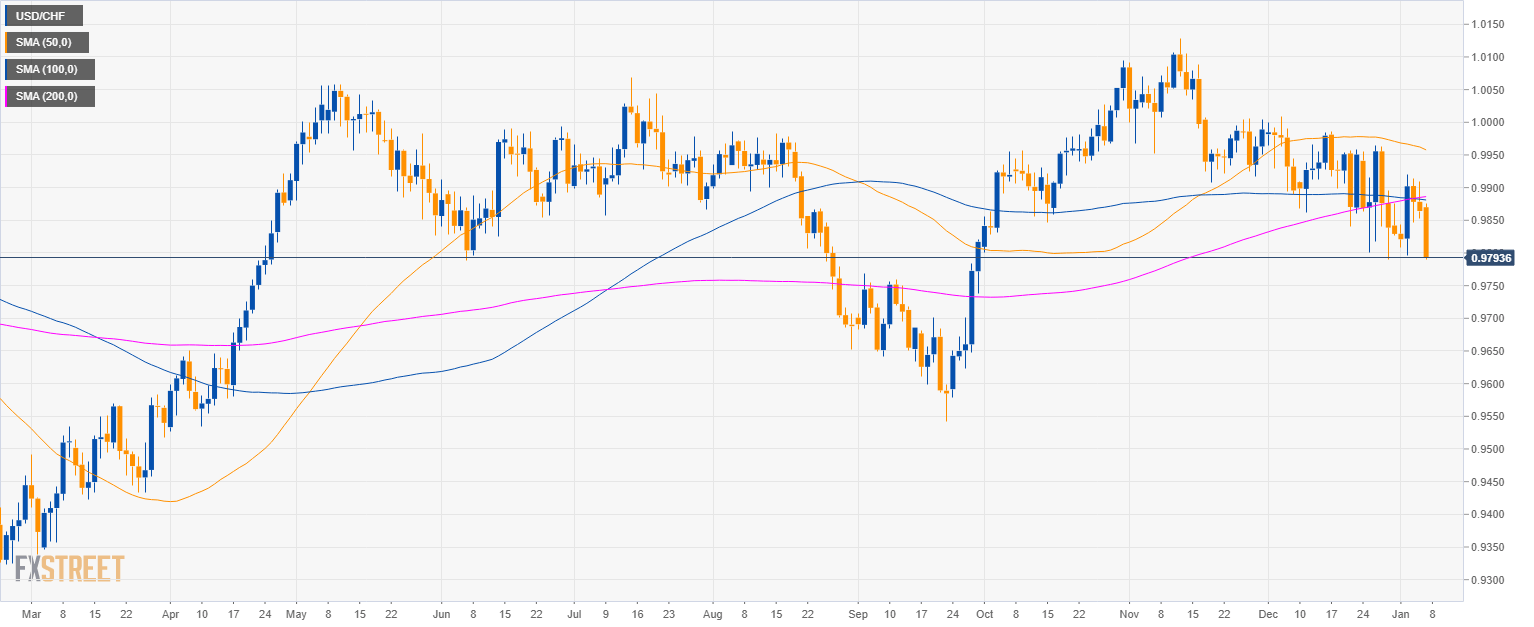
USD/CHF daily chart
- USD/CHF is trading in a sideways trend below the 50, 100 and 200-period simple moving average (SMA).
- USD/CHF is trading near its lowest level since early October.
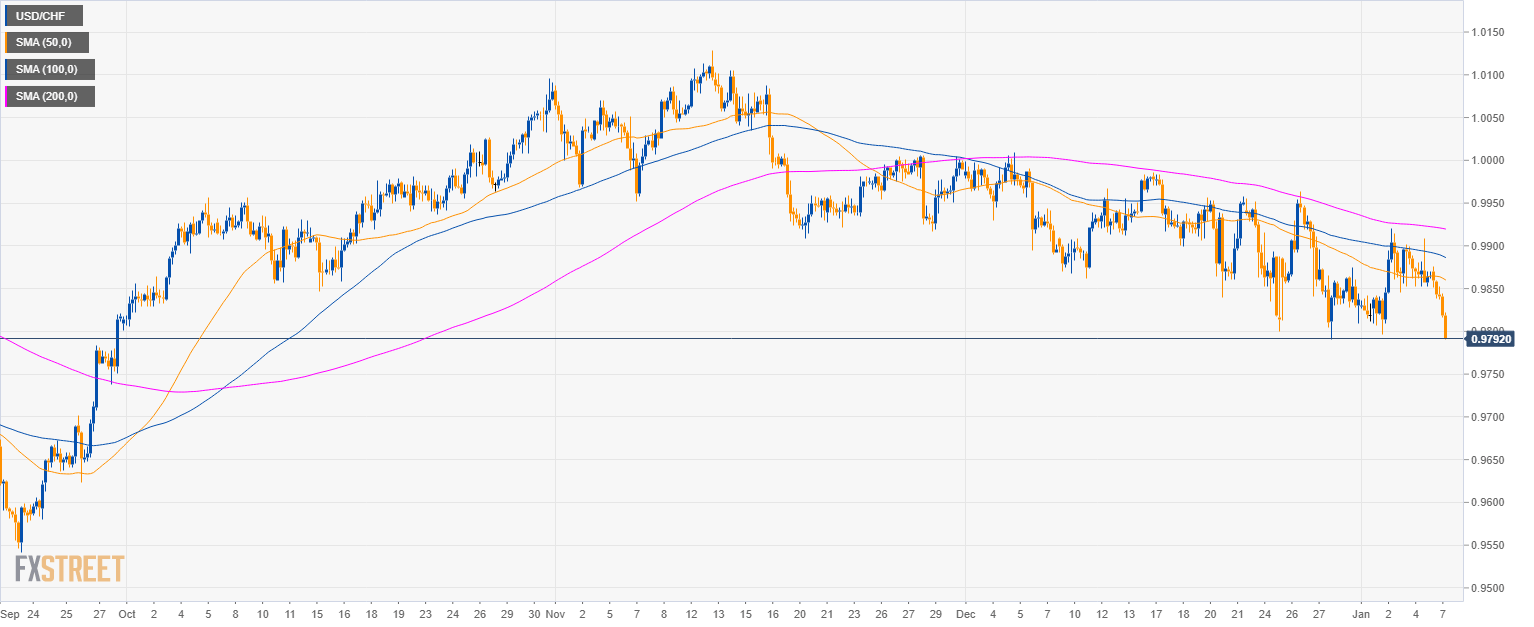
USD/CHF 4-hour chart
- USD/CHF is challenging the December 2018 low.
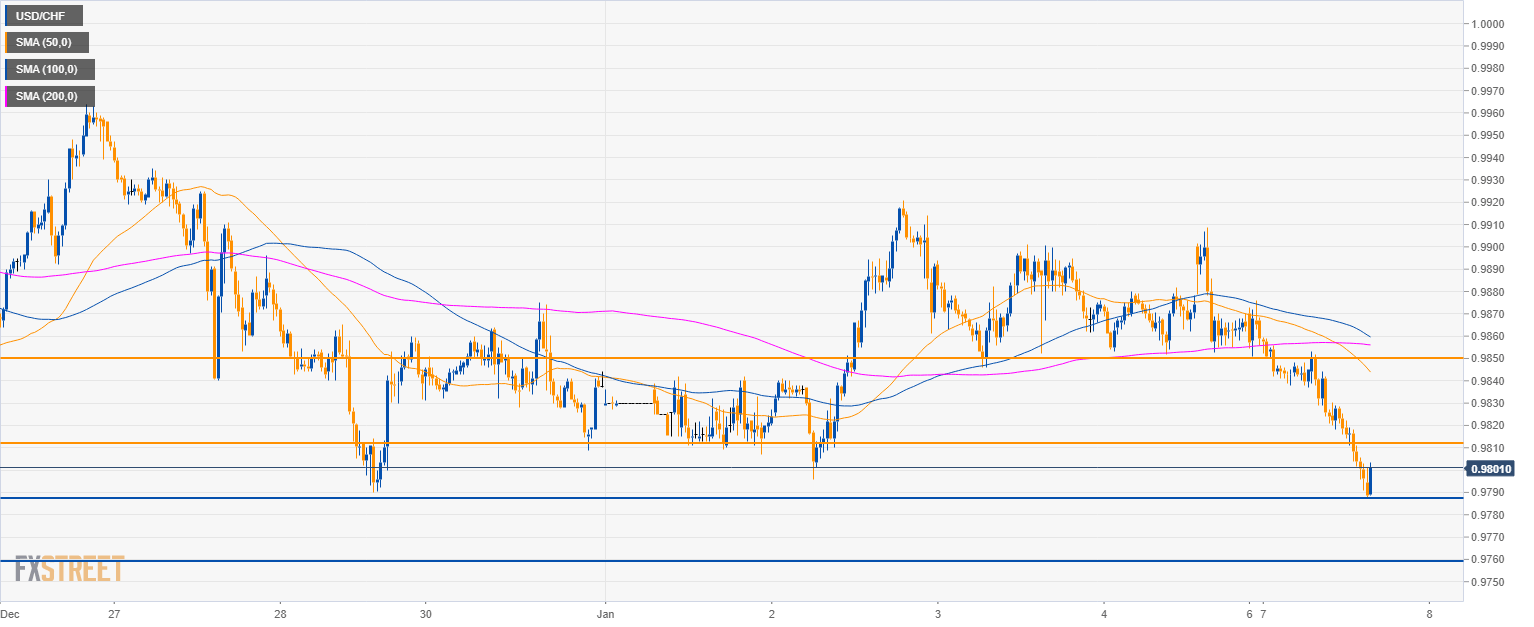
USD/CHF daily chart
- USD/CHF is trading below the 100 and 200 SMAs suggesting a bearish bias in the very short term.
- Resistance to the upside can be seen near 0.9810 and 0.9850 while to the downside 0.9790 should be broken for a continuation to 0.9760.
- As of now, nothing indicates bearish strength continuation in the coming sessions.
Additional key levels
USD/CHF
Overview:
Today Last Price: 0.9789
Today Daily change: -75 pips
Today Daily change %: -0.760%
Today Daily Open: 0.9864
Trends:
Previous Daily SMA20: 0.9901
Previous Daily SMA50: 0.9962
Previous Daily SMA100: 0.9883
Previous Daily SMA200: 0.9883
Levels:
Previous Daily High: 0.9909
Previous Daily Low: 0.9852
Previous Weekly High: 0.9921
Previous Weekly Low: 0.9796
Previous Monthly High: 1.0009
Previous Monthly Low: 0.979
Previous Daily Fibonacci 38.2%: 0.9874
Previous Daily Fibonacci 61.8%: 0.9887
Previous Daily Pivot Point S1: 0.9841
Previous Daily Pivot Point S2: 0.9818
Previous Daily Pivot Point S3: 0.9784
Previous Daily Pivot Point R1: 0.9898
Previous Daily Pivot Point R2: 0.9932
Previous Daily Pivot Point R3: 0.9955
