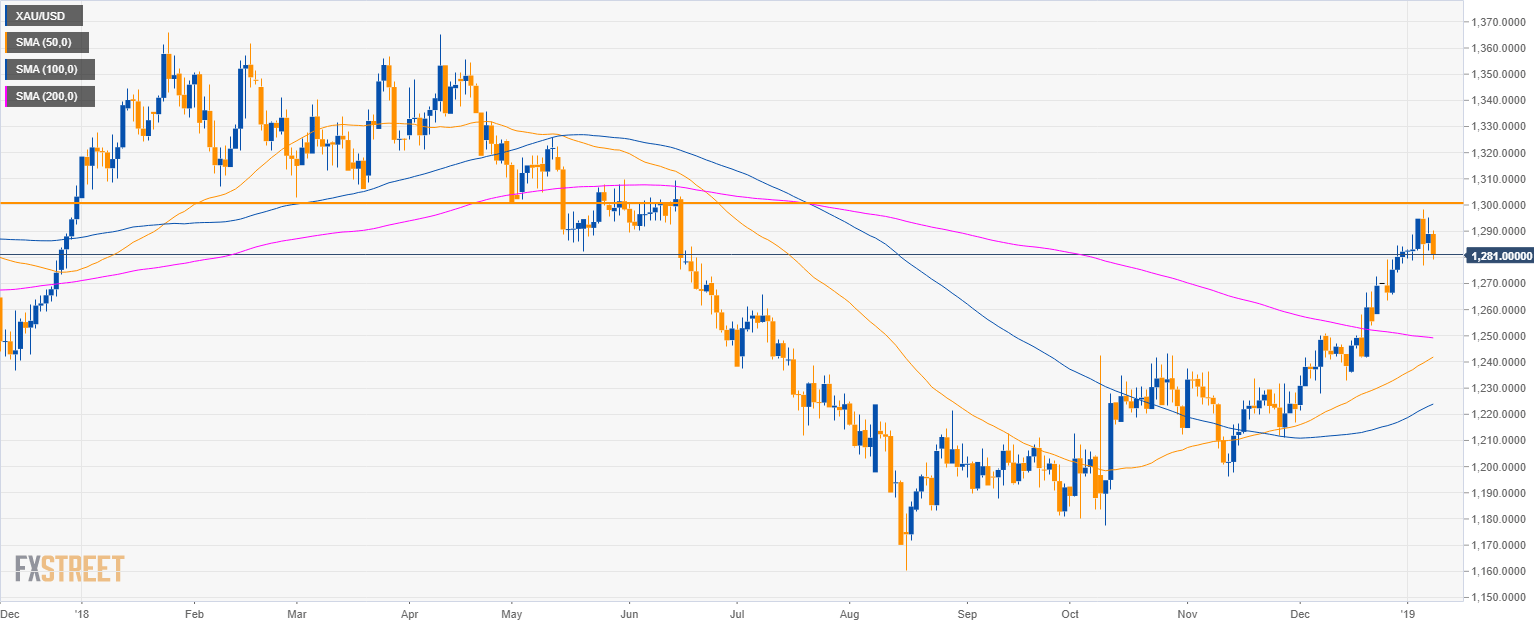
Gold daily chart
- Gold is trading in a bull trend above the 200-period simple moving average (SMA).
- Gold rejected $1,300.00 per ounce.
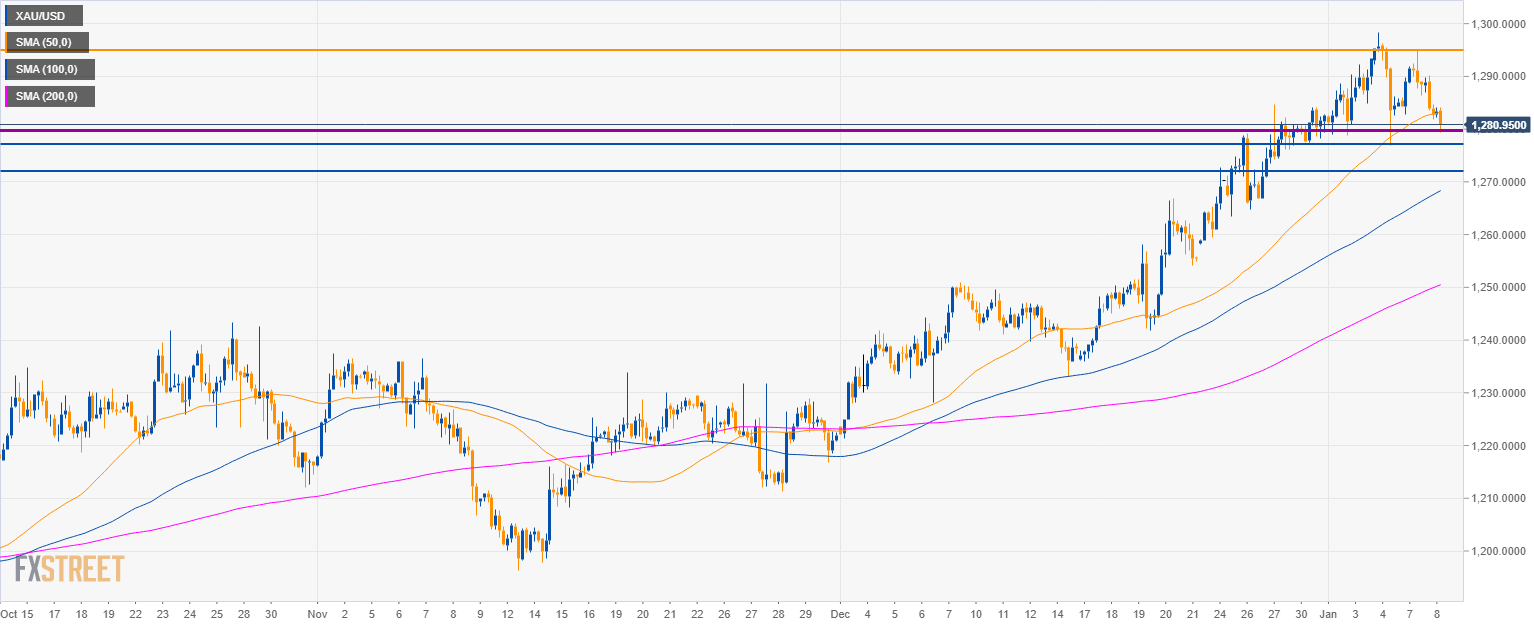
Gold 4-hour chart
- $1,280.00/oz is a very important support. A bearish break below it will likely be significant in the coming weeks.
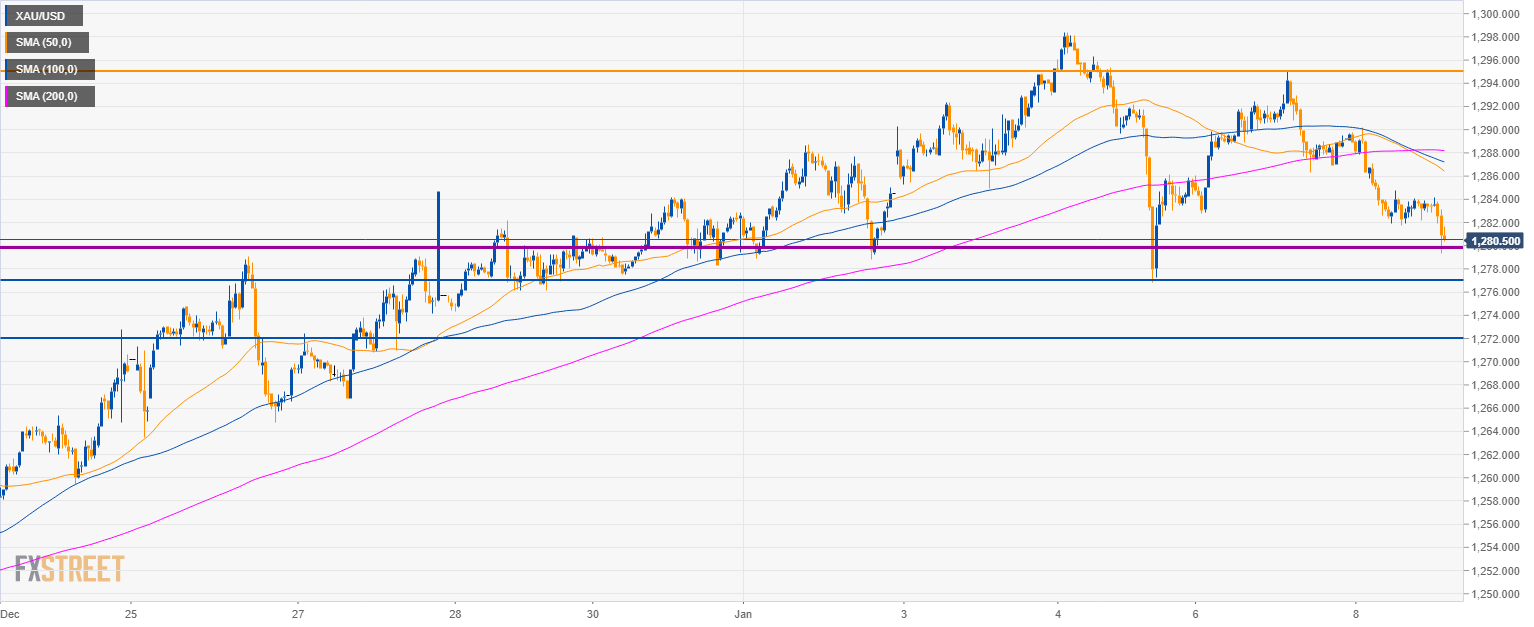
Gold 30-minute chart
- A break below 1,280.00 would likely lead to a drop to 1,277.00 and 1,272.00.
- To the upside, resistance is located near 1,295.35.
Additional key levels
XAU/USD
Overview:
Today Last Price: 1280.7
Today Daily change: -8.2e+2 pips
Today Daily change %: -0.638%
Today Daily Open: 1288.92
Trends:
Previous Daily SMA20: 1265.09
Previous Daily SMA50: 1240
Previous Daily SMA100: 1224.98
Previous Daily SMA200: 1229.16
Levels:
Previous Daily High: 1295.03
Previous Daily Low: 1282.75
Previous Weekly High: 1298.42
Previous Weekly Low: 1276.82
Previous Monthly High: 1284.7
Previous Monthly Low: 1221.39
Previous Daily Fibonacci 38.2%: 1290.34
Previous Daily Fibonacci 61.8%: 1287.44
Previous Daily Pivot Point S1: 1282.77
Previous Daily Pivot Point S2: 1276.62
Previous Daily Pivot Point S3: 1270.49
Previous Daily Pivot Point R1: 1295.05
Previous Daily Pivot Point R2: 1301.18
Previous Daily Pivot Point R3: 1307.33
