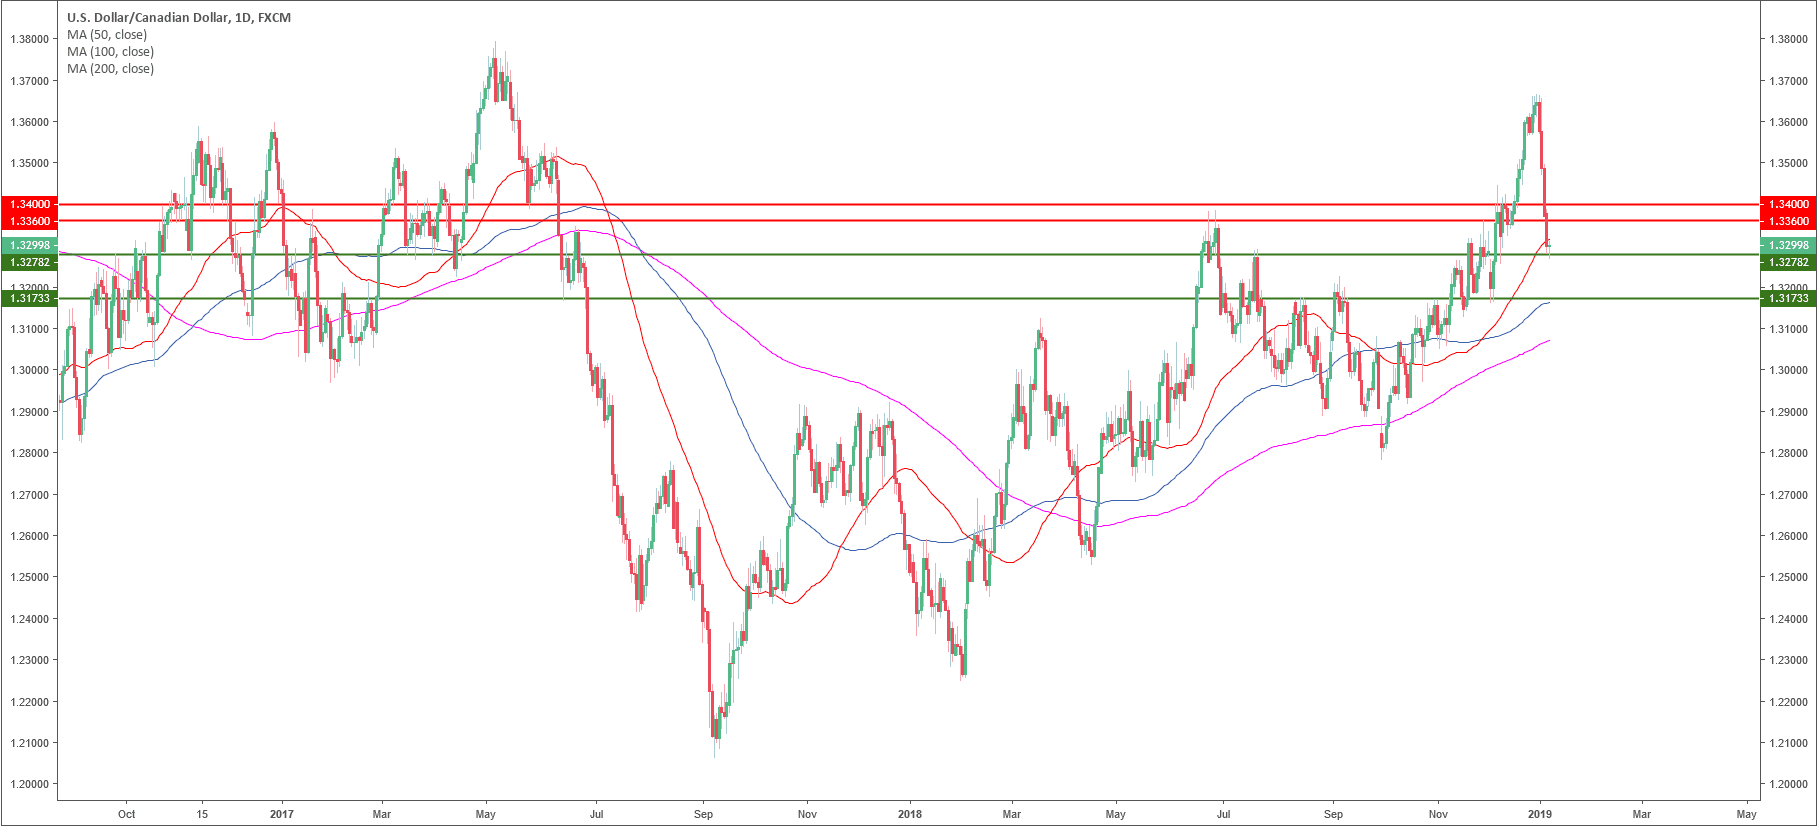
USD/CAD daily chart
- USD/CAD is trading in a bull trend above the 100 and 200-period simple moving averages (SMAs).
- USD/CAD is having a deep pullback to the 50 SMA and is now challenging the 1.3300 figure.
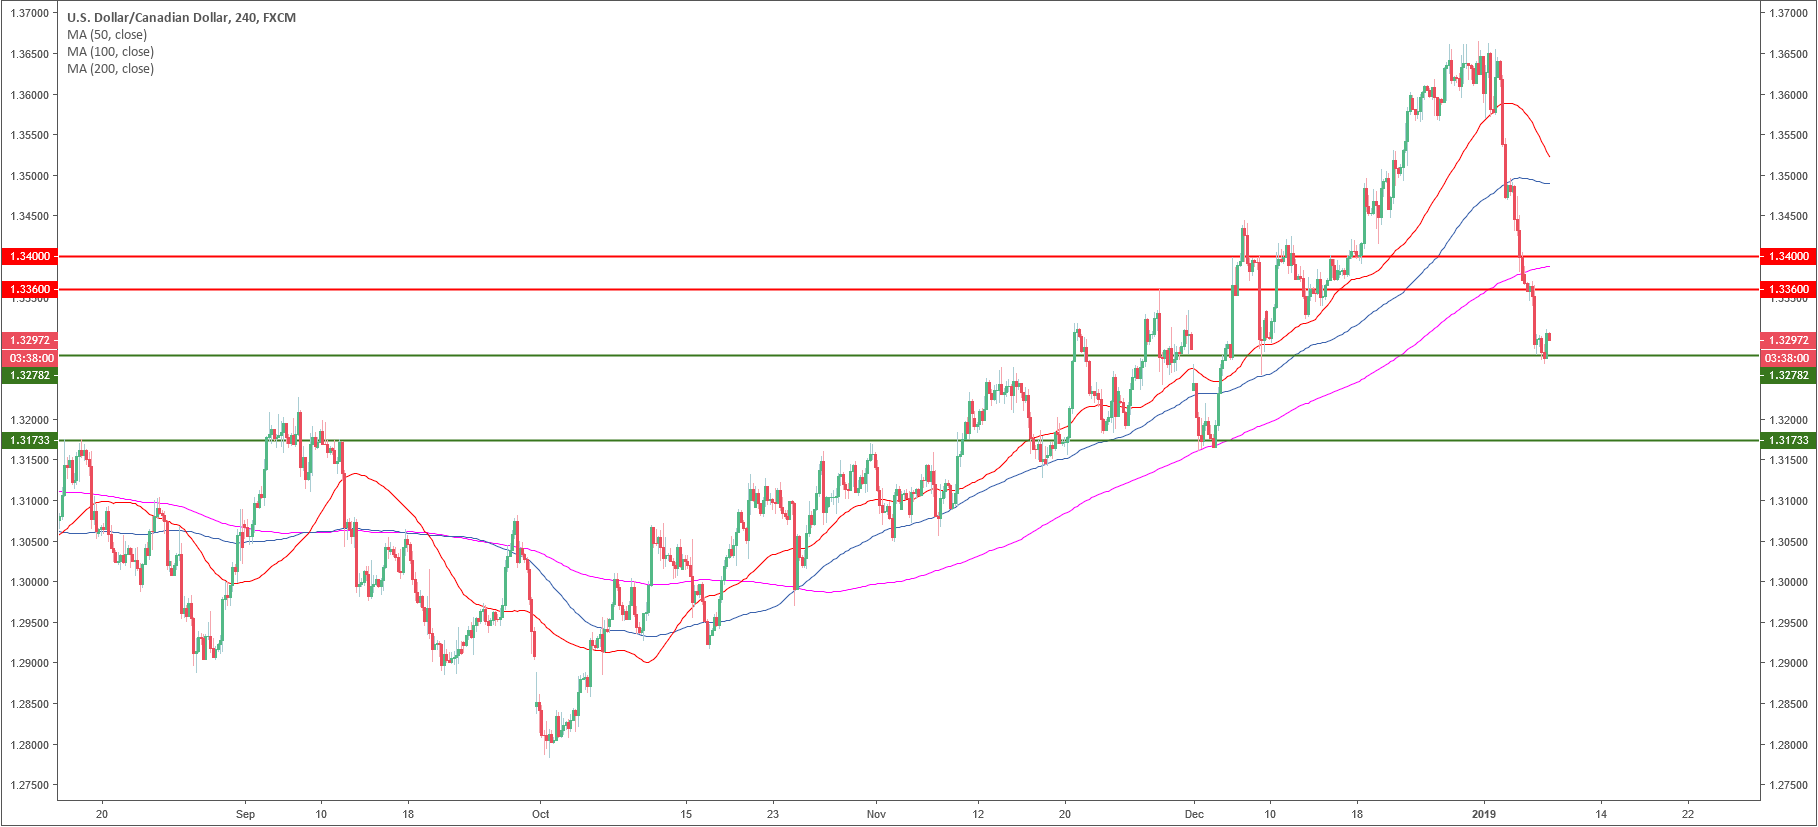
USD/CAD 4-hour chart
- USD/CAD broke below its main SMAs.
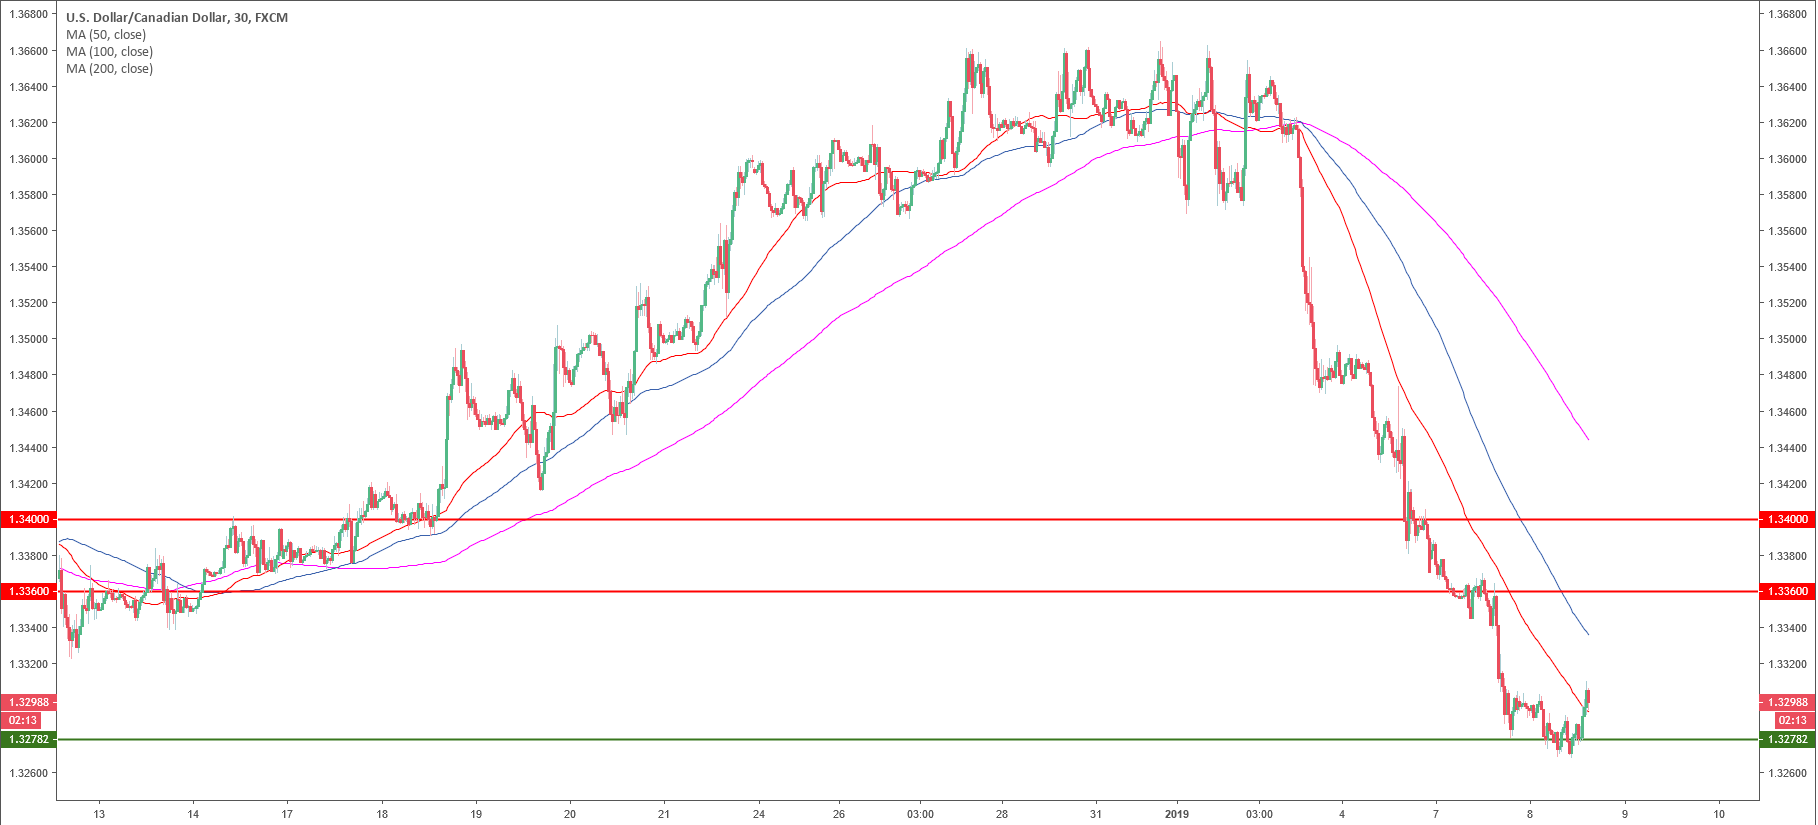
USD/CAD 30-minute chart
- USD/CAD is trading below its main SMAs while 1.3280 is acting as strong support.
- In the coming sessions, 1.3360 and 1.3400 are likely the next bull targets with a possible extension to the 1.3420 level.
Additional key levels
USD/CAD
Overview:
Today Last Price: 1.33
Today Daily change: 3.0 pips
Today Daily change %: 0.0226%
Today Daily Open: 1.3297
Trends:
Previous Daily SMA20: 1.3528
Previous Daily SMA50: 1.3345
Previous Daily SMA100: 1.3179
Previous Daily SMA200: 1.3078
Levels:
Previous Daily High: 1.339
Previous Daily Low: 1.3278
Previous Weekly High: 1.3666
Previous Weekly Low: 1.338
Previous Monthly High: 1.4134
Previous Monthly Low: 1.316
Previous Daily Fibonacci 38.2%: 1.3321
Previous Daily Fibonacci 61.8%: 1.3348
Previous Daily Pivot Point S1: 1.3253
Previous Daily Pivot Point S2: 1.321
Previous Daily Pivot Point S3: 1.3141
Previous Daily Pivot Point R1: 1.3365
Previous Daily Pivot Point R2: 1.3434
Previous Daily Pivot Point R3: 1.3477
