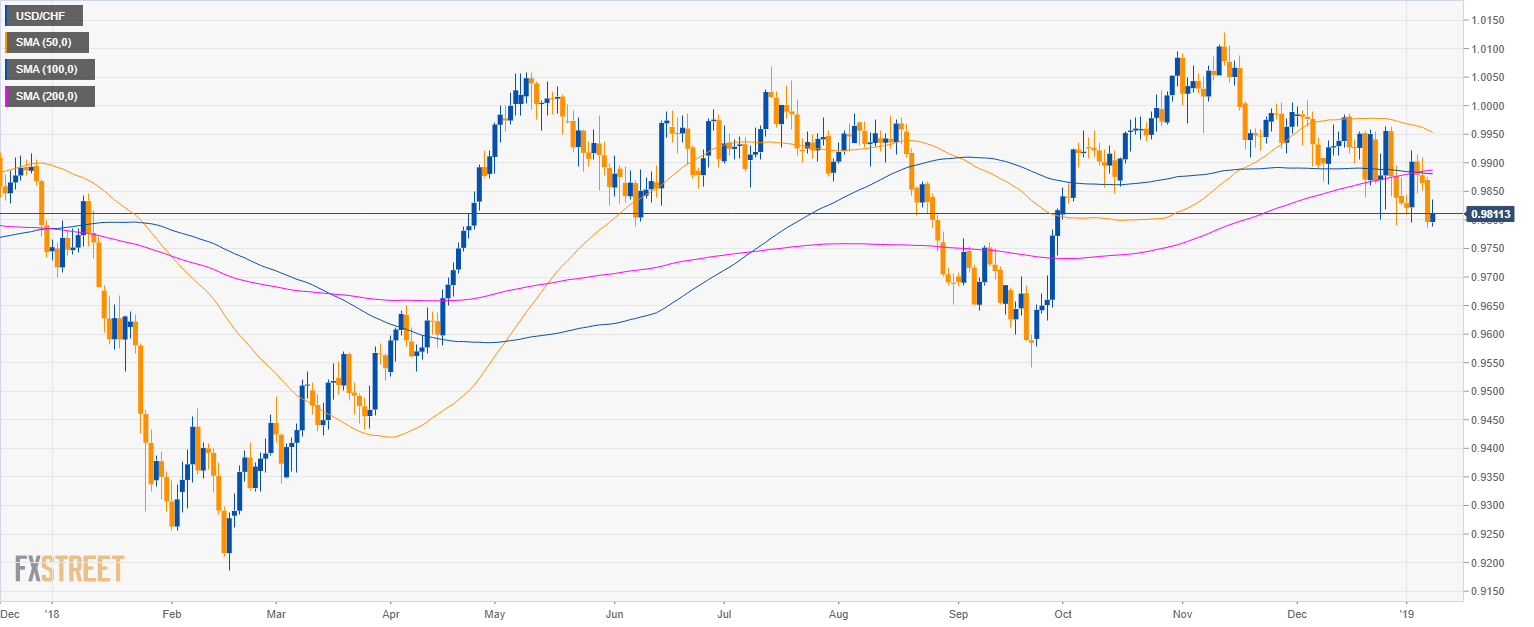
USD/CHF daily chart
- USD/CHF is trading in a sideways trend below the 50, 100 and 200-period simple moving average (SMA).
- USD/CHF is trading close to its lowest level since early October.
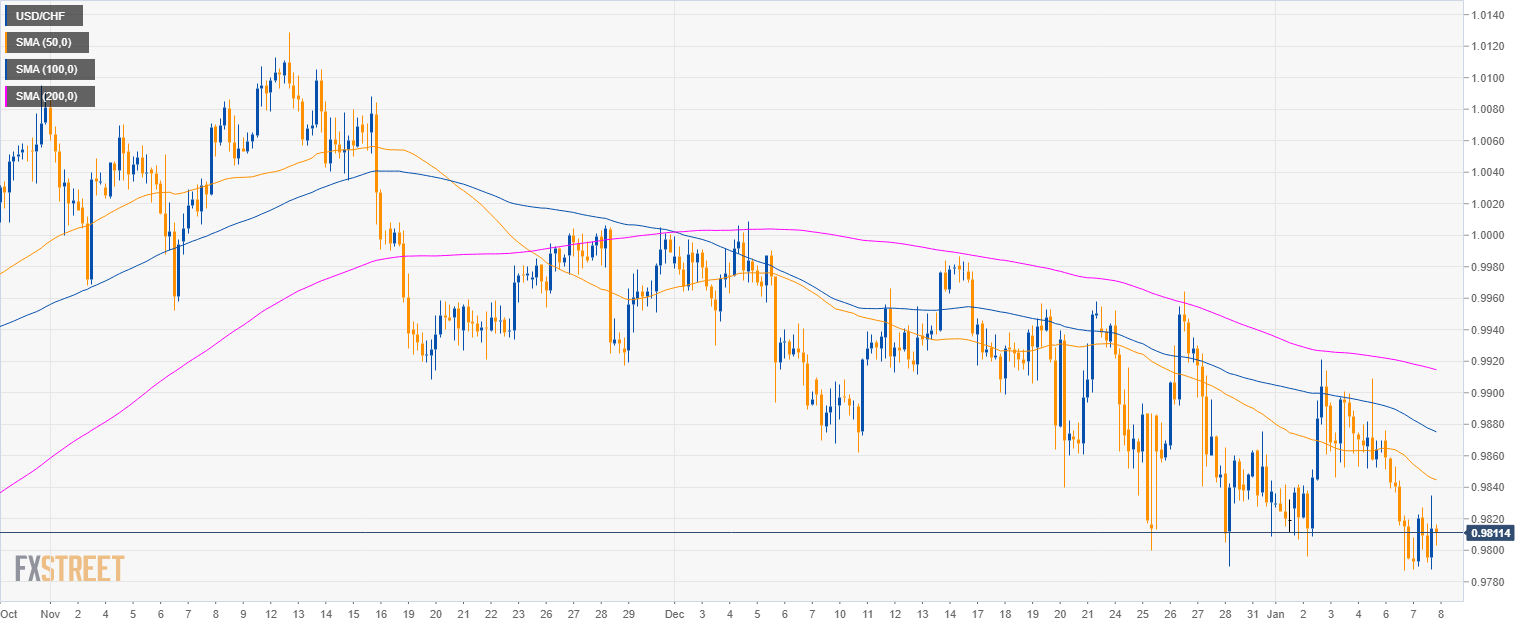
USD/CHF 4-hour chart
- USD/CHF is challenging the December 2018 low.
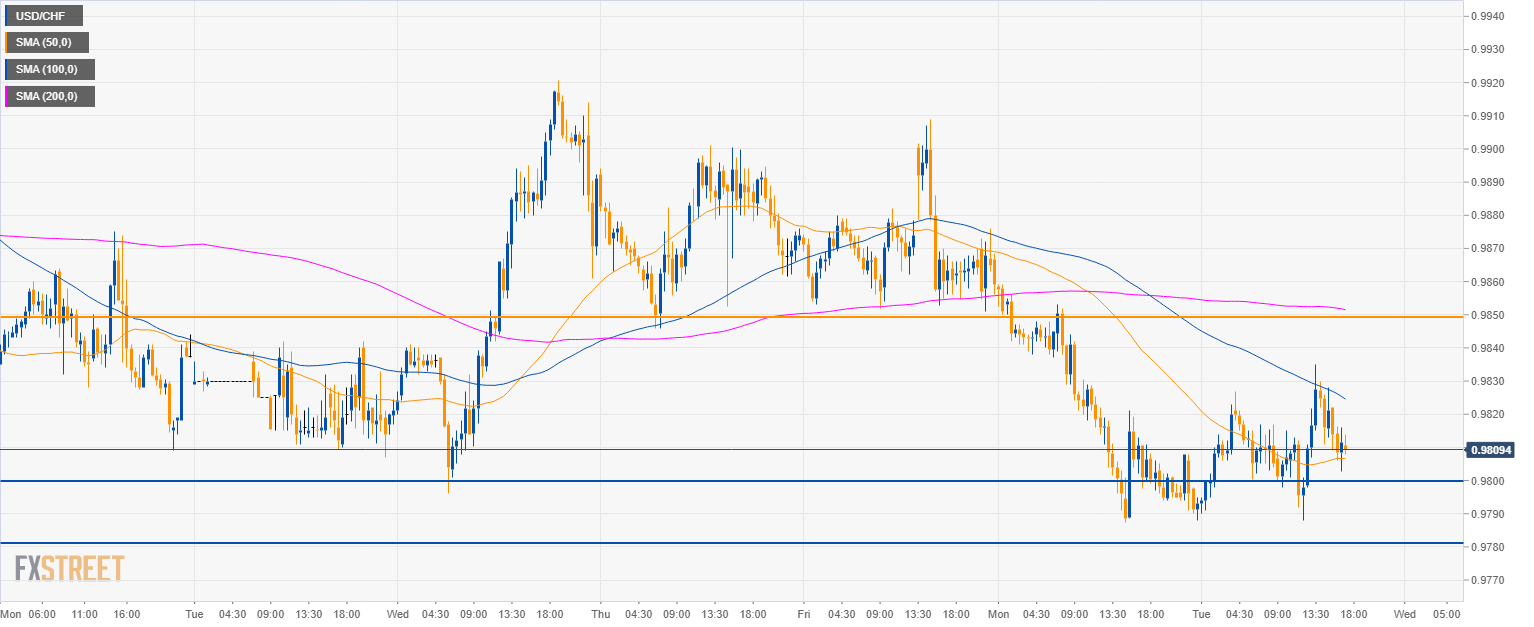
USD/CHF 30-minute chart
- USD/CHF bulls are finding support at the 50 SMA. Their objective is to reach the 0.9850 level.
- Support is seen at 0.9800 figure.
Additional key levels
USD/CHF
Overview:
Today Last Price: 0.9811
Today Daily change: 15 pips
Today Daily change %: 0.153%
Today Daily Open: 0.9796
Trends:
Previous Daily SMA20: 0.9895
Previous Daily SMA50: 0.9958
Previous Daily SMA100: 0.9881
Previous Daily SMA200: 0.9884
Levels:
Previous Daily High: 0.9876
Previous Daily Low: 0.9788
Previous Weekly High: 0.9921
Previous Weekly Low: 0.9796
Previous Monthly High: 1.0009
Previous Monthly Low: 0.979
Previous Daily Fibonacci 38.2%: 0.9821
Previous Daily Fibonacci 61.8%: 0.9842
Previous Daily Pivot Point S1: 0.9764
Previous Daily Pivot Point S2: 0.9732
Previous Daily Pivot Point S3: 0.9676
Previous Daily Pivot Point R1: 0.9853
Previous Daily Pivot Point R2: 0.9909
Previous Daily Pivot Point R3: 0.9941
