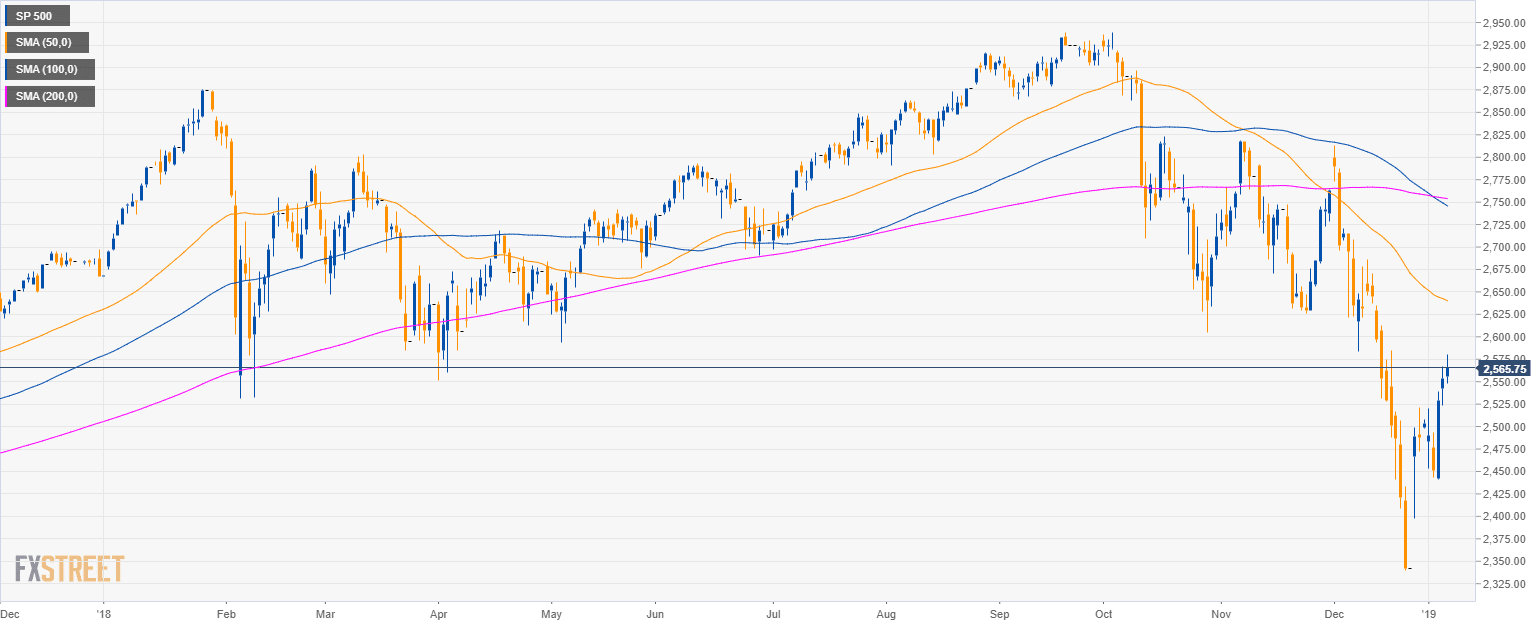
S&P500 daily chart
- The S&P500 is having a deep pullback below the 50, 100 and 200-period simple moving averages (SMAs).
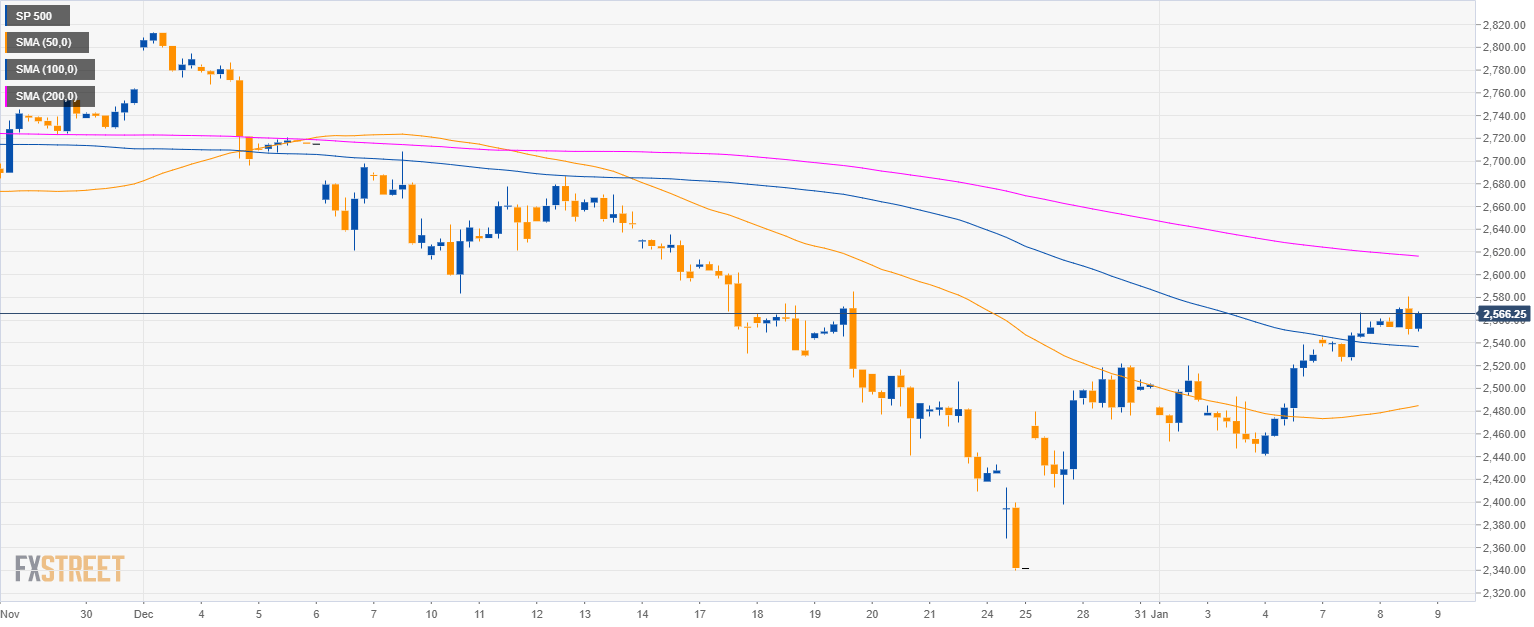
S&P500 4-hour chart
- The S&P500 broke above the 2,500.00 figure and the 50 SMA.
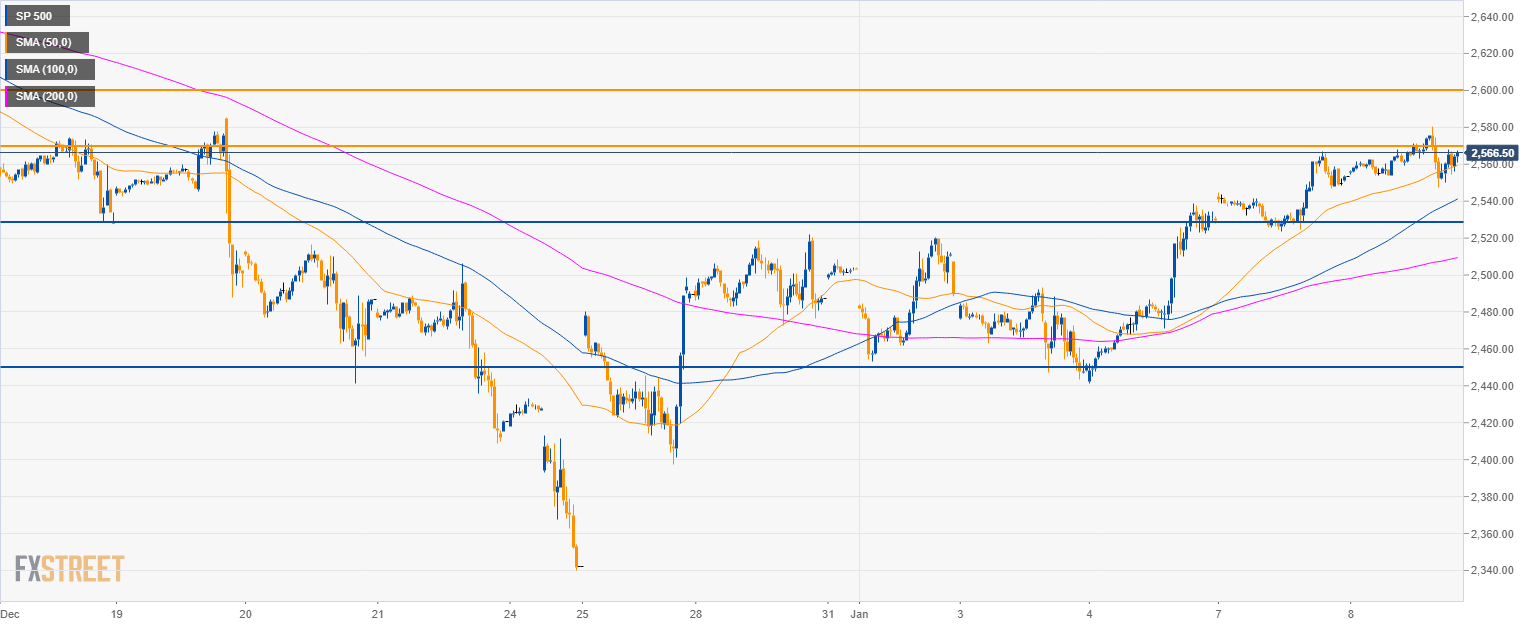
S&P500 30-minute chart
- Bulls are trading above the main SMAs suggesting bullish momentum.
- A breakout above the 2,570.00 level would open the doors to 2,600.00 resistance.
Additional key levels
SP 500
Overview:
Today Last Price: 2563.75
Today Daily change: 1.0e+3 pips
Today Daily change %: 0.401%
Today Daily Open: 2553.5
Trends:
Previous Daily SMA20: 2523.99
Previous Daily SMA50: 2642.52
Previous Daily SMA100: 2748.94
Previous Daily SMA200: 2754.61
Levels:
Previous Daily High: 2566.75
Previous Daily Low: 2523.5
Previous Weekly High: 2539
Previous Weekly Low: 2441
Previous Monthly High: 2813.5
Previous Monthly Low: 2340.25
Previous Daily Fibonacci 38.2%: 2550.23
Previous Daily Fibonacci 61.8%: 2540.02
Previous Daily Pivot Point S1: 2529.08
Previous Daily Pivot Point S2: 2504.67
Previous Daily Pivot Point S3: 2485.83
Previous Daily Pivot Point R1: 2572.33
Previous Daily Pivot Point R2: 2591.17
Previous Daily Pivot Point R3: 2615.58
