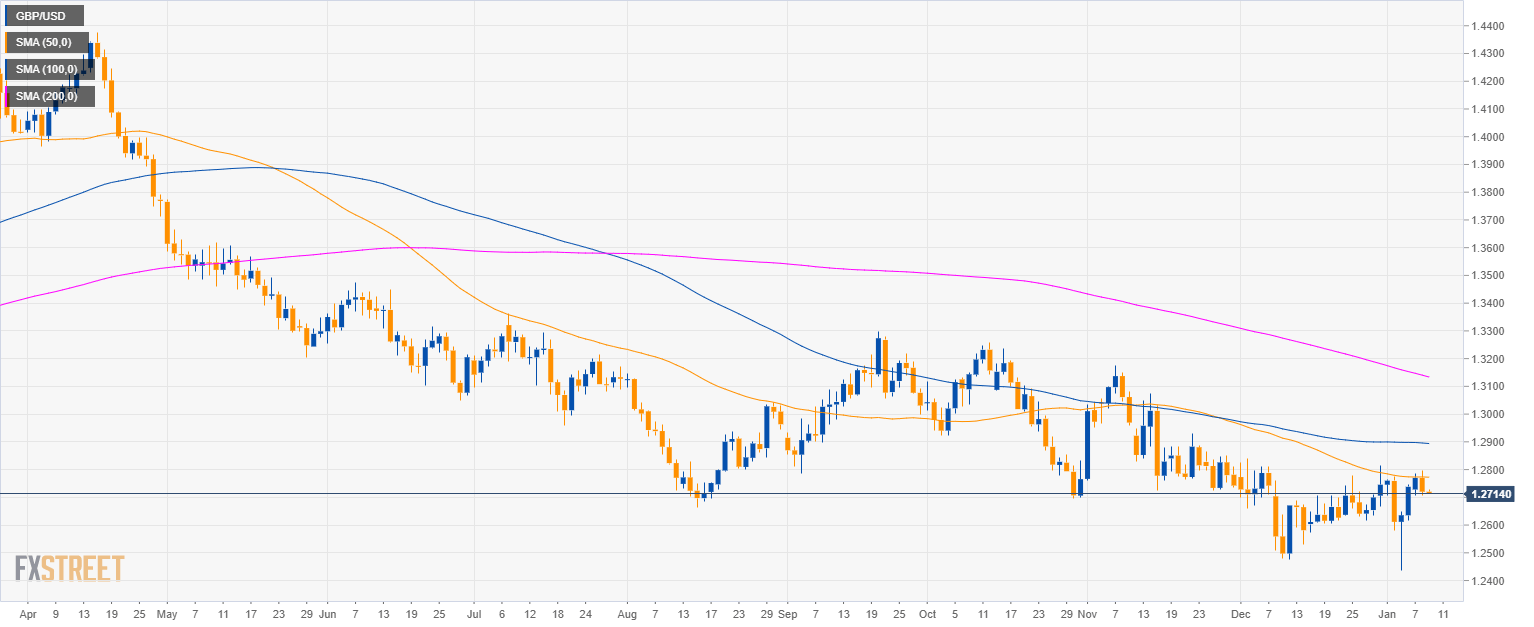
GBP/USD daily chart
- GBP/USD is trading in a bear trend below the 200 SMA.
- GBP/USD rejected the 50 SMA near the 1.2800 figure.
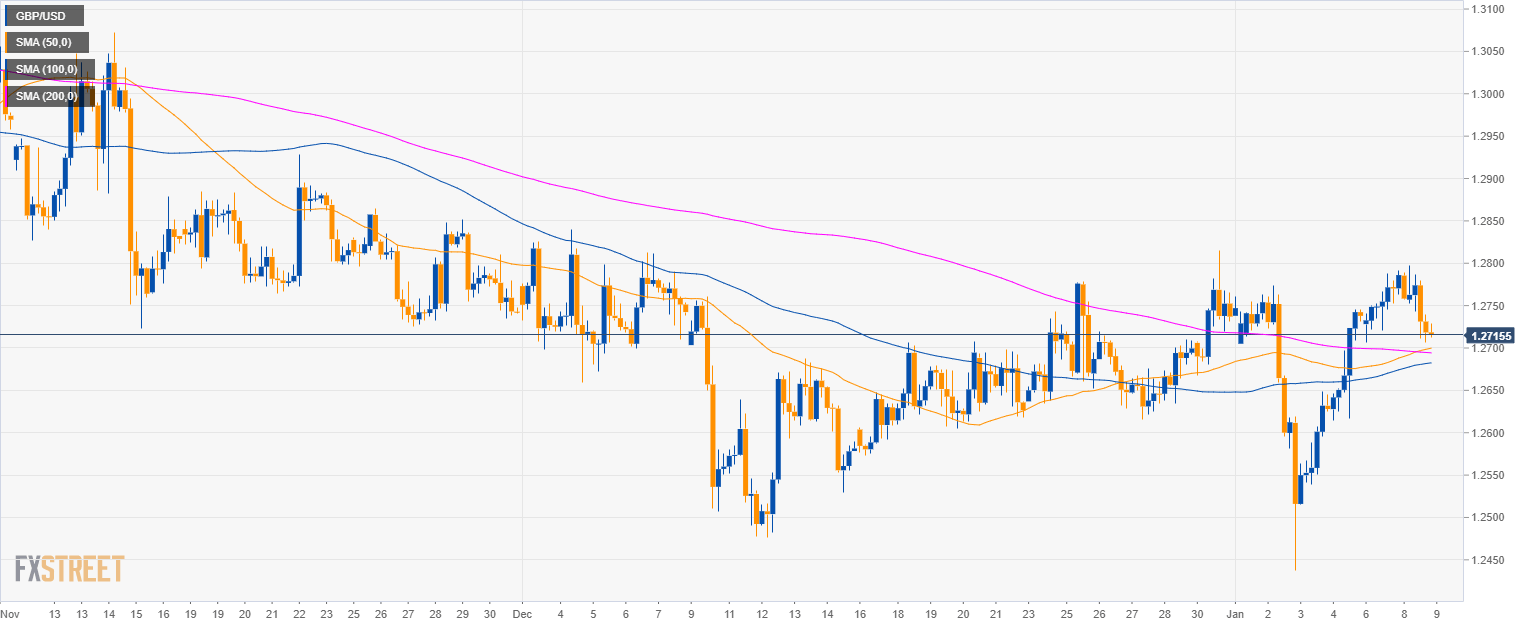
GBP/USD 4-hour chart
- GBP/USD rejected the December and January highs.
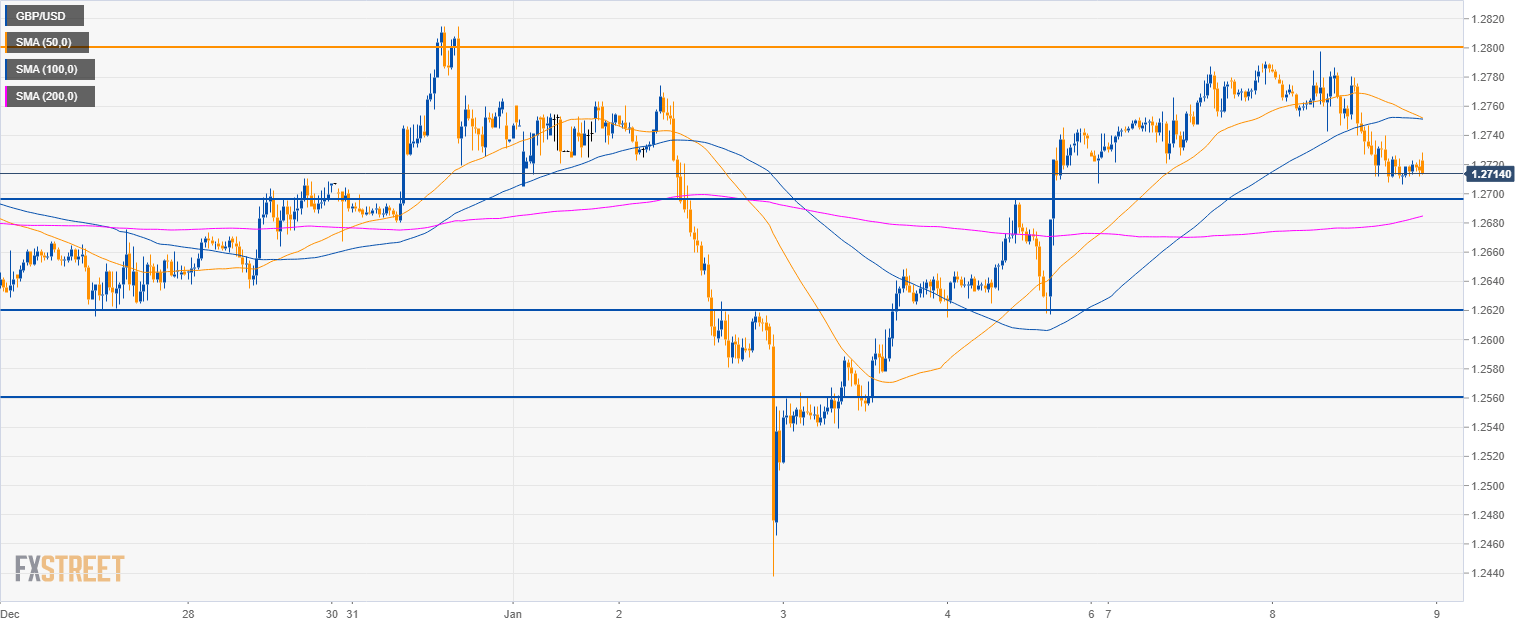
GBP/USD 30-minute chart
- Bears broke below the 50 and 100 SMA.
- A break below 1.2700 should open the way to the 1.2620 level.
Additional key levels
GBP/USD
Overview:
Today Last Price: 1.2714
Today Daily change: -56 pips
Today Daily change %: -0.439%
Today Daily Open: 1.277
Trends:
Previous Daily SMA20: 1.2661
Previous Daily SMA50: 1.2773
Previous Daily SMA100: 1.2897
Previous Daily SMA200: 1.3149
Levels:
Previous Daily High: 1.2788
Previous Daily Low: 1.2707
Previous Weekly High: 1.2815
Previous Weekly Low: 1.2438
Previous Monthly High: 1.284
Previous Monthly Low: 1.2477
Previous Daily Fibonacci 38.2%: 1.2757
Previous Daily Fibonacci 61.8%: 1.2738
Previous Daily Pivot Point S1: 1.2722
Previous Daily Pivot Point S2: 1.2674
Previous Daily Pivot Point S3: 1.2642
Previous Daily Pivot Point R1: 1.2803
Previous Daily Pivot Point R2: 1.2835
Previous Daily Pivot Point R3: 1.2883
