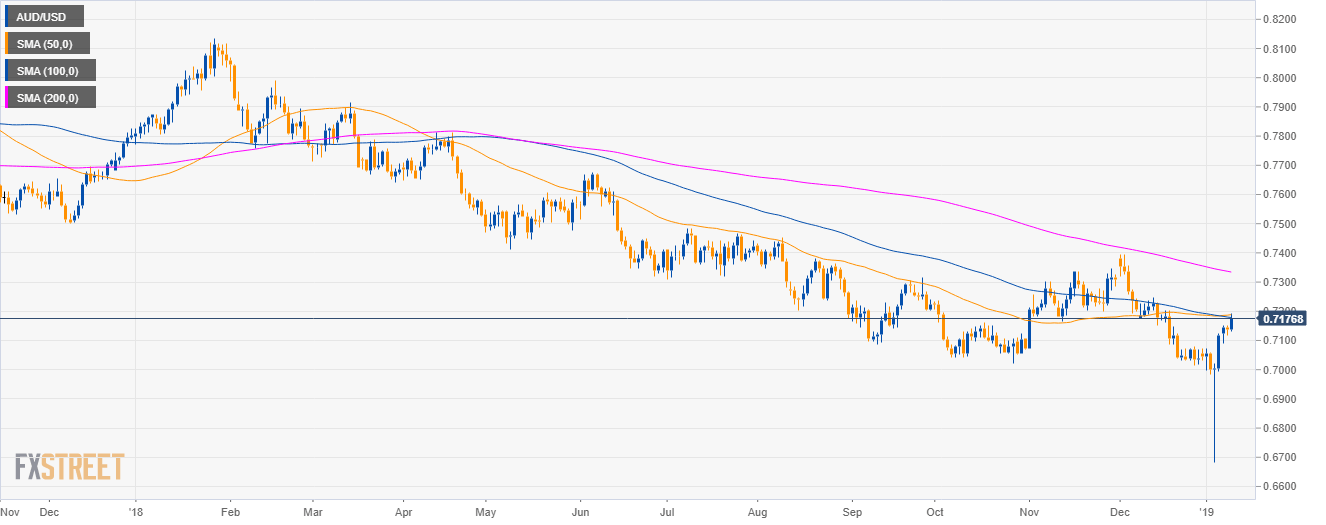
AUD/USD daily chart
- AUD/USD is trading in a bear trend below the 200 SMA.
- AUD/USD is testing the 50 and 100 SMA near the 0.7200 figure.
- The FOMC minutes at 19:00 GMT will likely provide high volatility in the forex market.
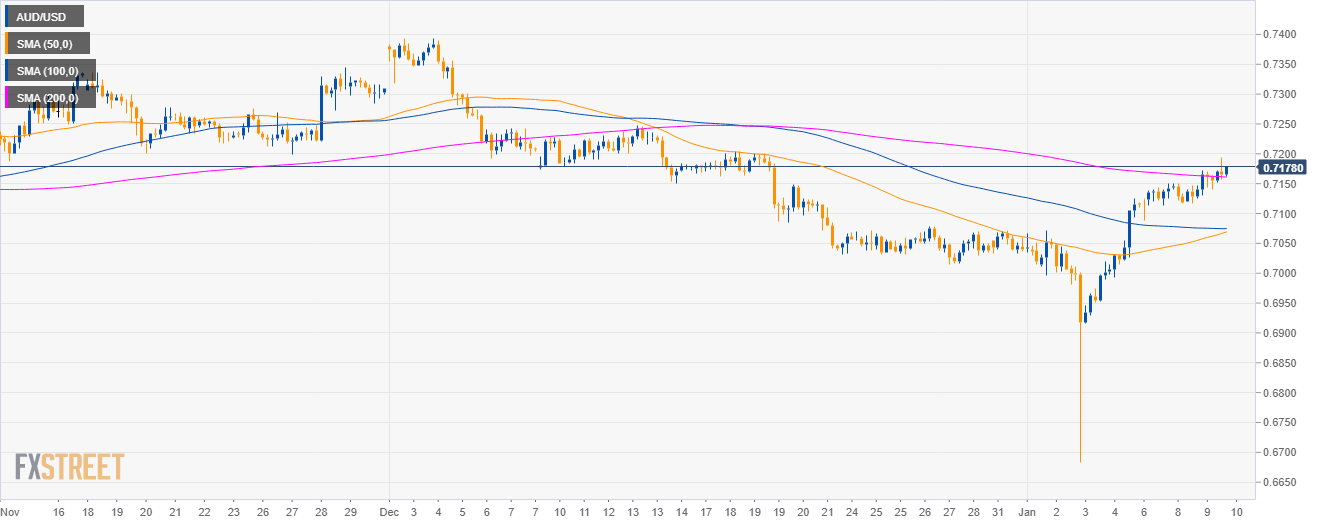
AUD/USD 4-hour chart
- AUD/USD is reclaiming the 0.7150 level end the 200 SMA.
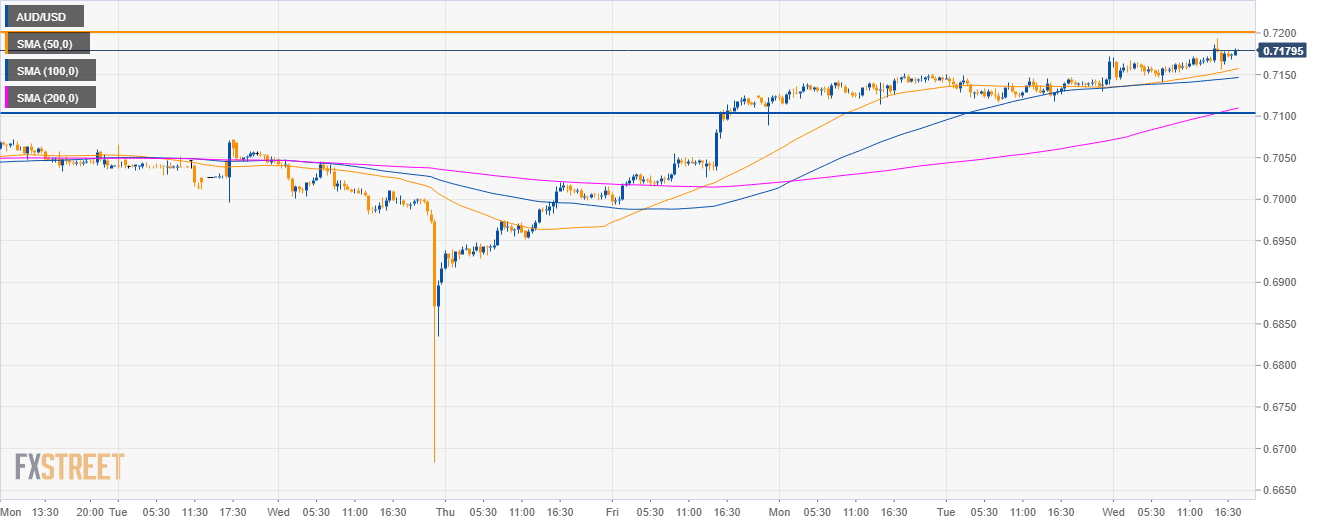
AUD/USD 30-minute chart
- The level to beat for bulls is the 0.7200 figure.
- On the flip side, bears have the main trend on their side and the main target to the downside might be located near 0.7100 figure.
Additional key levels
AUD/USD
Overview:
Today Last Price: 0.7177
Today Daily change: 38 pips
Today Daily change %: 0.532%
Today Daily Open: 0.7139
Trends:
Previous Daily SMA20: 0.7099
Previous Daily SMA50: 0.7187
Previous Daily SMA100: 0.7181
Previous Daily SMA200: 0.7338
Levels:
Previous Daily High: 0.7151
Previous Daily Low: 0.7116
Previous Weekly High: 0.7125
Previous Weekly Low: 0.6684
Previous Monthly High: 0.7394
Previous Monthly Low: 0.7014
Previous Daily Fibonacci 38.2%: 0.7129
Previous Daily Fibonacci 61.8%: 0.7138
Previous Daily Pivot Point S1: 0.712
Previous Daily Pivot Point S2: 0.71
Previous Daily Pivot Point S3: 0.7085
Previous Daily Pivot Point R1: 0.7155
Previous Daily Pivot Point R2: 0.717
Previous Daily Pivot Point R3: 0.719
