“¢ The bearish pressure now seems to have abated, with the pair finding some support ahead of 100-day SMA and snapping six consecutive days of losing streak.
“¢ Given this week’s bearish breakthrough 50-day SMA and a 3-month-old ascending trend-line confluence support, the uptick could be solely attributed to short-covering.
USD/CAD daily chart
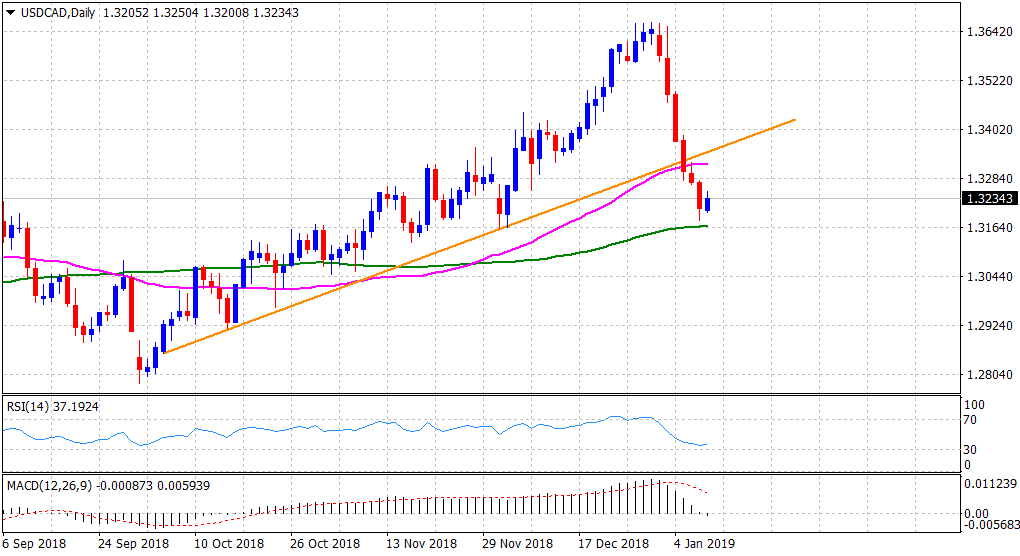
“¢ Highly oversold conditions on hourly charts seemed to be the only factor lending support and assisting the pair to stall its recent sharp fall from over 19-month tops.
“¢ Meanwhile, a fall of over 1% in oil prices isn’t helping the commodity-linked Loonie either and remains supportive of the attempted recovery move.
“¢ The uptick, however, remained capped at 100-hour SMA, currently around mid-1.3200s, and might now act as a key pivot-point in defining the intraday trajectory.
1-hourly chart

USD/CAD
Overview:
Today Last Price: 1.3236
Today Daily change: 20 pips
Today Daily change %: 0.151%
Today Daily Open: 1.3216
Trends:
Previous Daily SMA20: 1.3514
Previous Daily SMA50: 1.335
Previous Daily SMA100: 1.3183
Previous Daily SMA200: 1.3082
Levels:
Previous Daily High: 1.3284
Previous Daily Low: 1.318
Previous Weekly High: 1.3666
Previous Weekly Low: 1.338
Previous Monthly High: 1.4134
Previous Monthly Low: 1.316
Previous Daily Fibonacci 38.2%: 1.3219
Previous Daily Fibonacci 61.8%: 1.3244
Previous Daily Pivot Point S1: 1.3169
Previous Daily Pivot Point S2: 1.3123
Previous Daily Pivot Point S3: 1.3066
Previous Daily Pivot Point R1: 1.3273
Previous Daily Pivot Point R2: 1.333
Previous Daily Pivot Point R3: 1.3376
