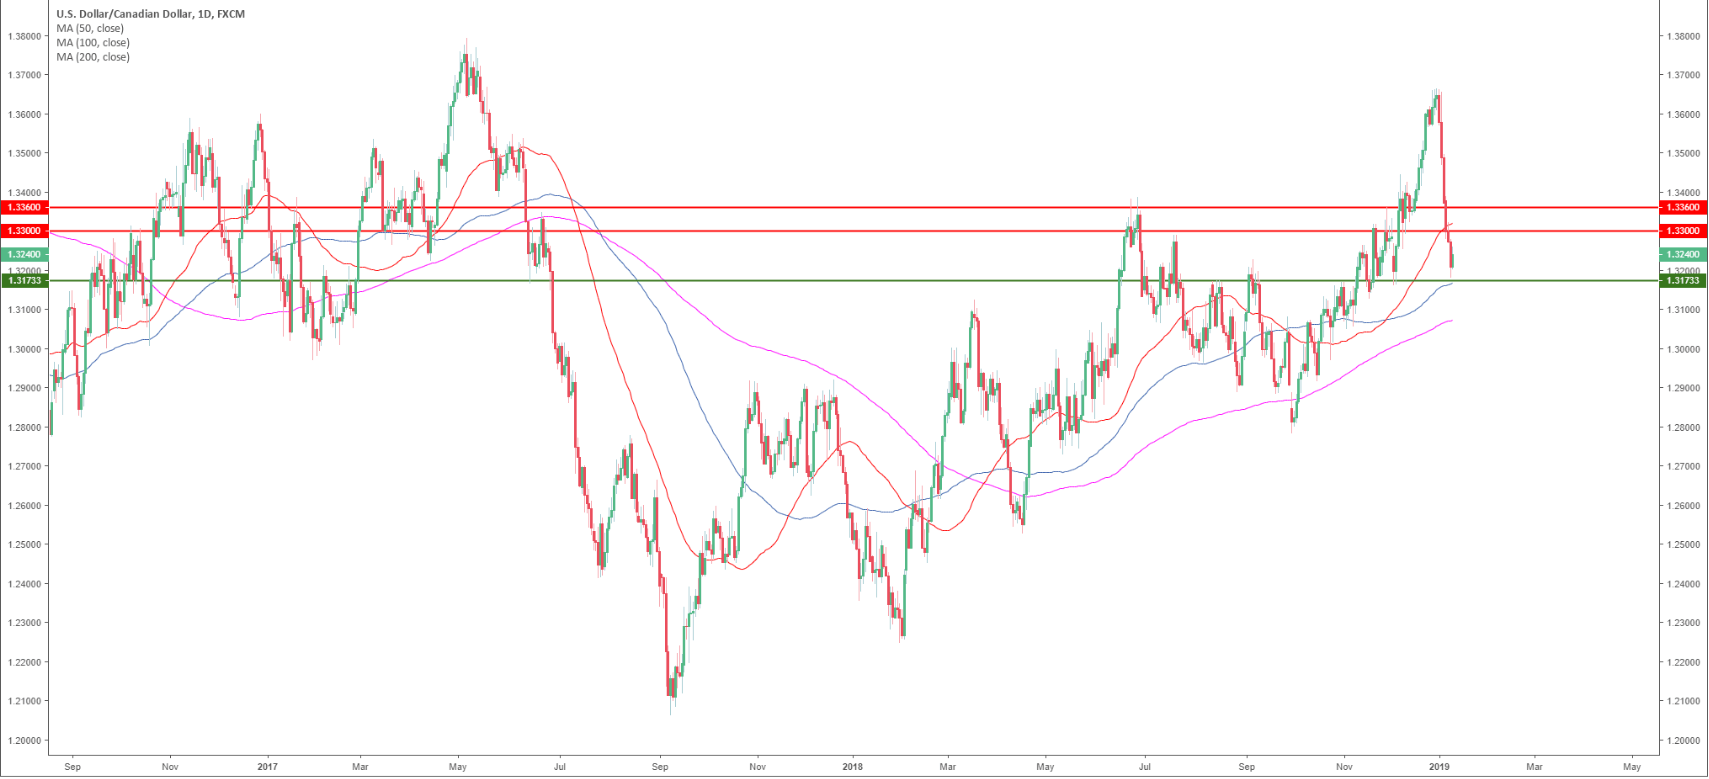
USD/CAD Daily chart
- USD/CAD is trading in a bull trend above the 200 SMA.
- USD/CAD is consolidating the recent losses above 1.3200 and the 100 SMA.
- Fed’s Powell speech today at 17.00 GMT can lead to high volatility.
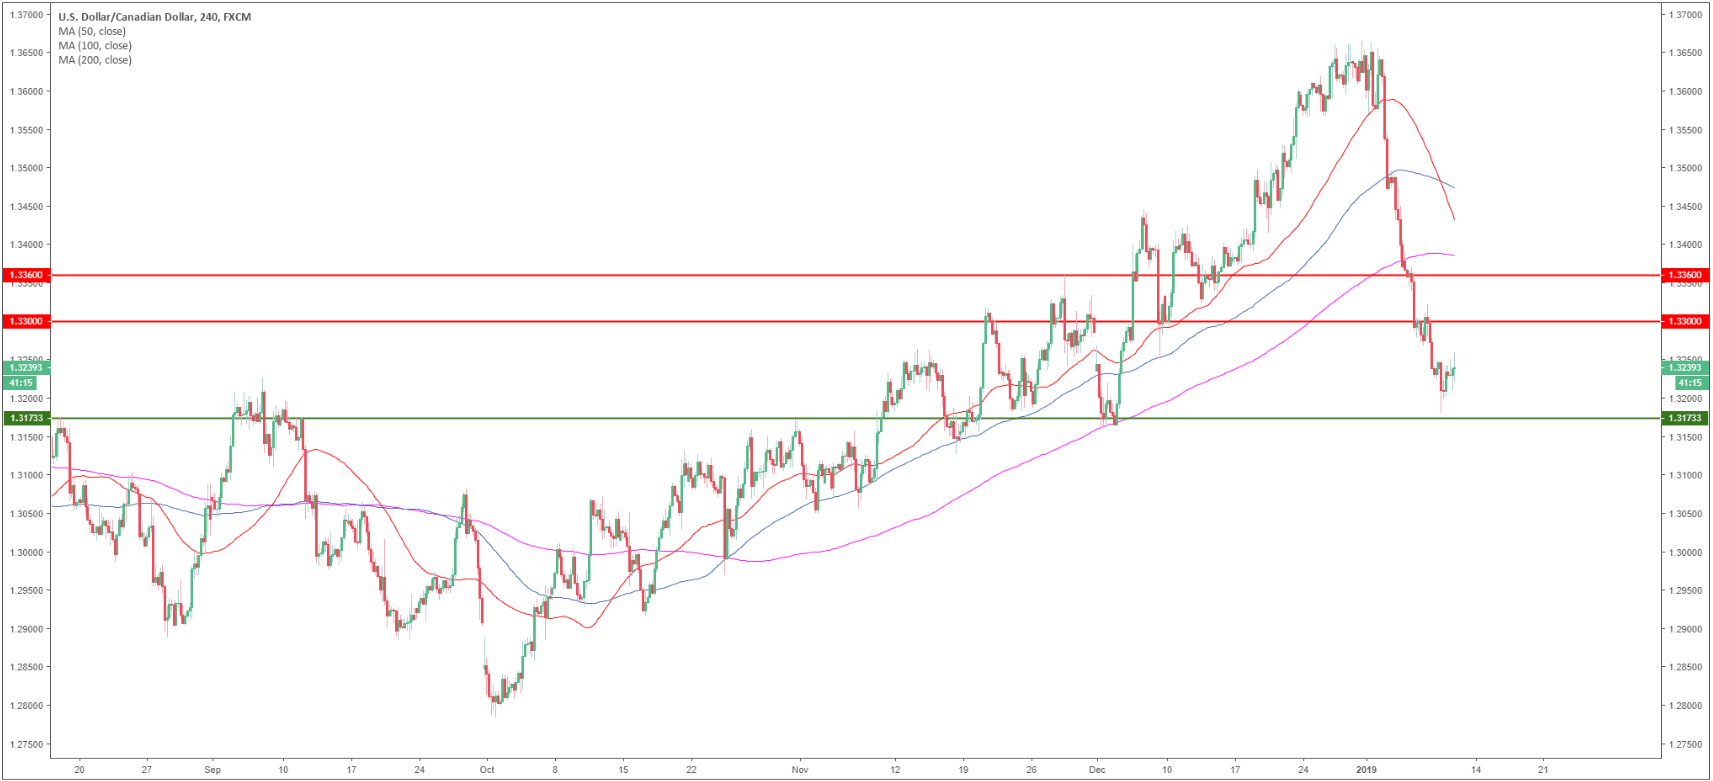
USD/CAD 4-hour chart
- USD/CAD is trading well below its main SMAs.
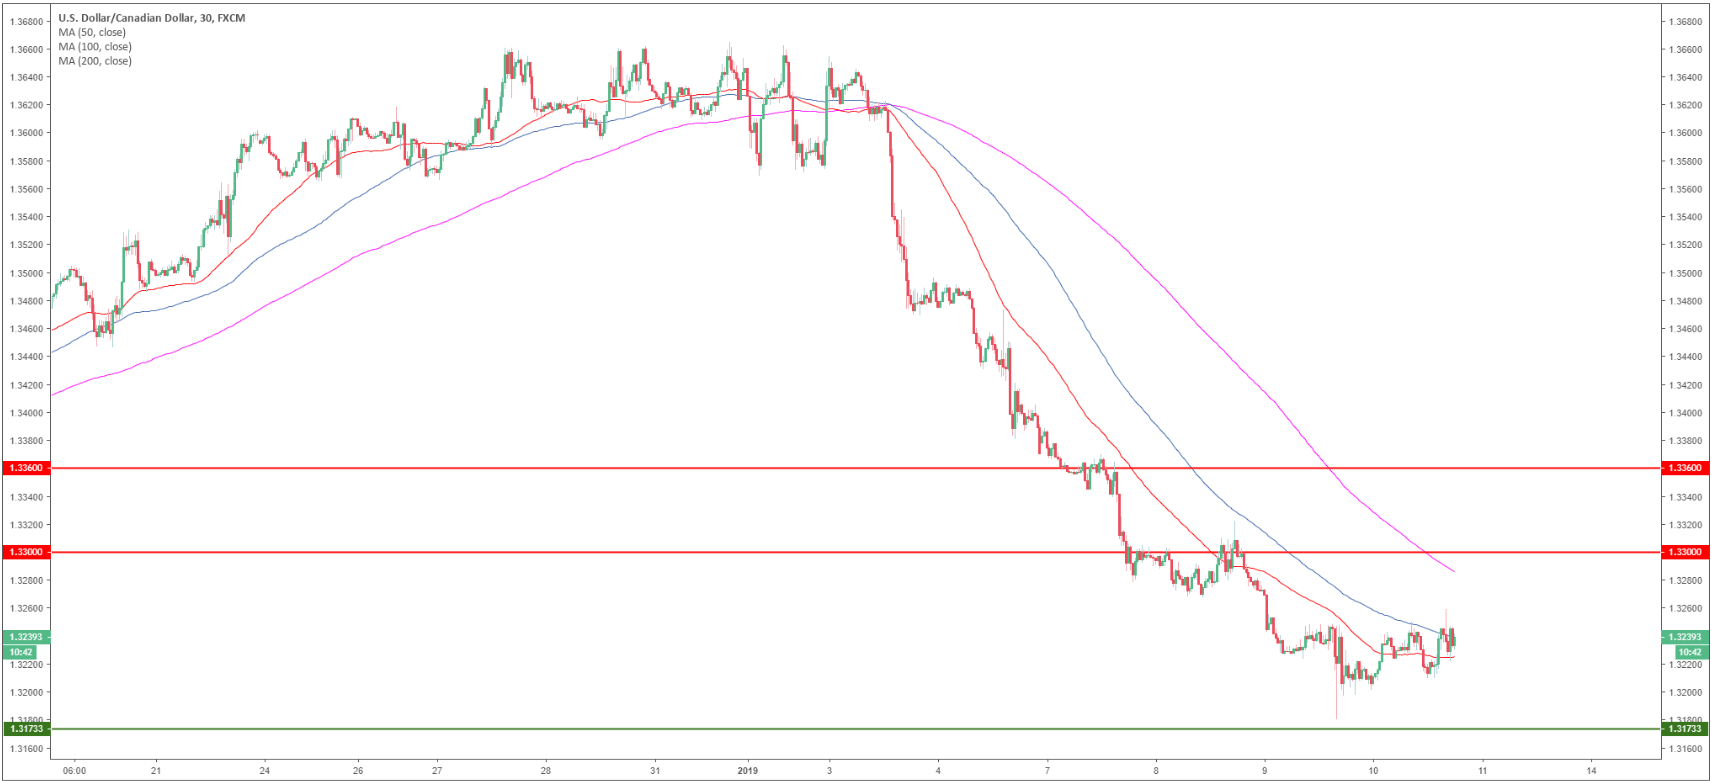
USD/CAD 30-minute chart
- On lower time-frames USD bulls managed to regain the 50 SMA and are at work trying to break above the 100 SMA.
- As the main trend is bullish targets to the upside can be located near the 1.3300 and 1.3360 levels.
Additional key levels
USD/CAD
Overview:
Today Last Price: 1.3241
Today Daily change: 25 pips
Today Daily change %: 0.189%
Today Daily Open: 1.3216
Trends:
Previous Daily SMA20: 1.3514
Previous Daily SMA50: 1.335
Previous Daily SMA100: 1.3183
Previous Daily SMA200: 1.3082
Levels:
Previous Daily High: 1.3284
Previous Daily Low: 1.318
Previous Weekly High: 1.3666
Previous Weekly Low: 1.338
Previous Monthly High: 1.4134
Previous Monthly Low: 1.316
Previous Daily Fibonacci 38.2%: 1.3219
Previous Daily Fibonacci 61.8%: 1.3244
Previous Daily Pivot Point S1: 1.3169
Previous Daily Pivot Point S2: 1.3123
Previous Daily Pivot Point S3: 1.3066
Previous Daily Pivot Point R1: 1.3273
Previous Daily Pivot Point R2: 1.333
Previous Daily Pivot Point R3: 1.3376
