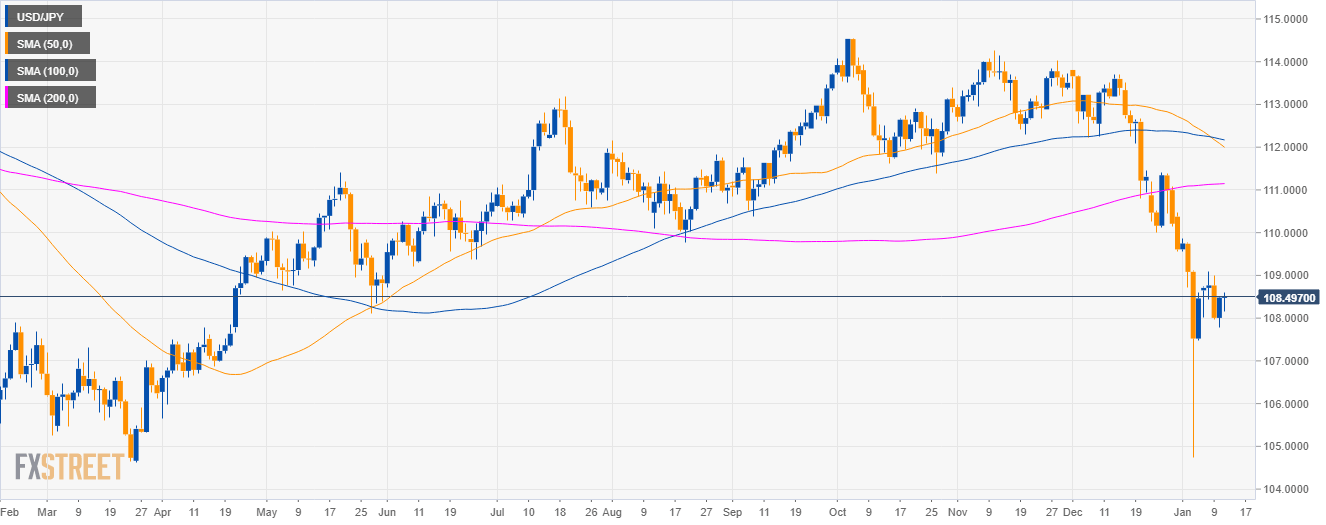
USD/JPY daily chart
- USD/JPY is in a deep pullback below the 50, 100 and 200-period simple moving averages (SMAs).
- USD/JPY is trading more than 300-pips up following the flash crash last week.
- Earlier this Friday, the US CPI (Consumer Producer Index) matched analysts forecasts at 2.2% for December y/y.
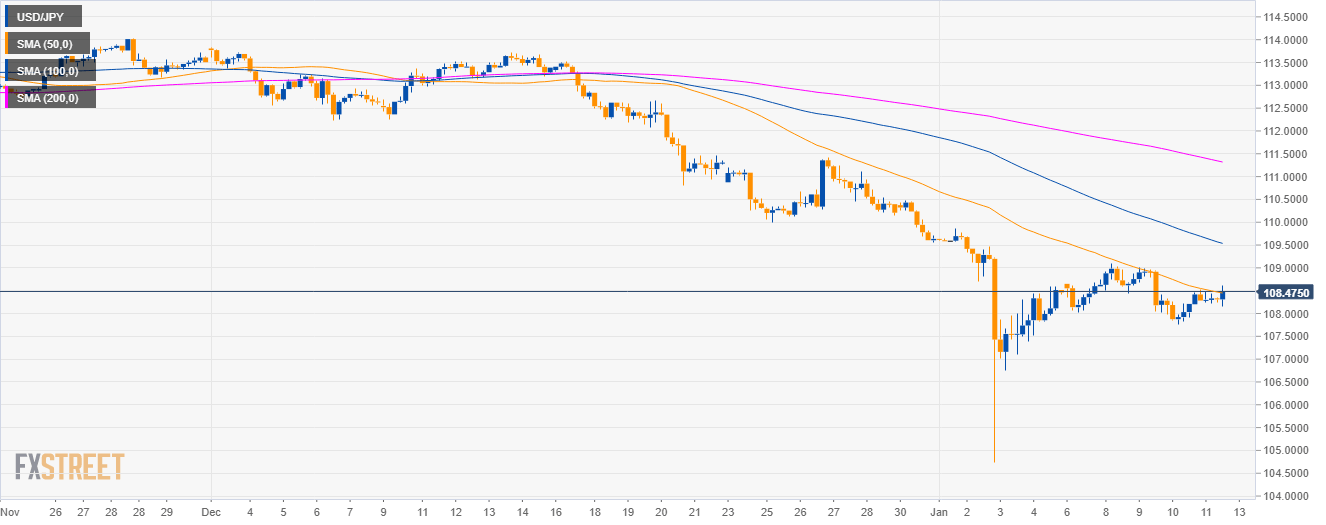
USD/JPY 4-hour chart
- USD/JPY bulls are challenging the 50 SMA as the Greenback is having a boost across the board.
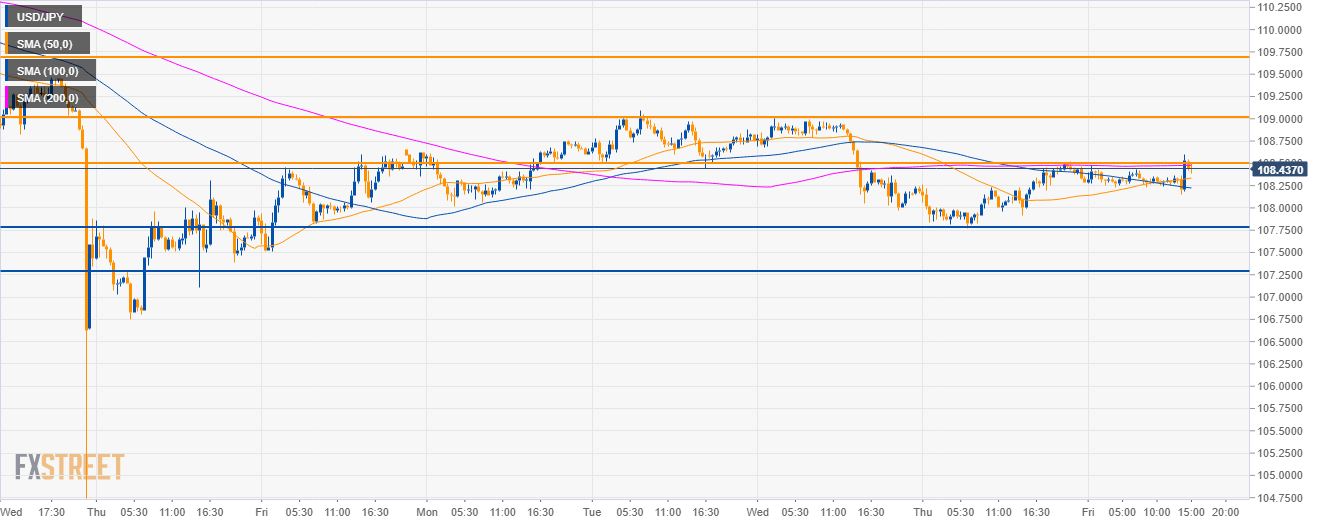
USD/JPY 30-minute chart
- Bulls are gaining ground as they reclaimed the 50 and 100 SMA and are now challenging the 108.50 resistance.
- A break of the level would open the doors to further gains and a potential run to 109.00 resistance.
Additional key levels
USD/JPY
Overview:
Today Last Price: 108.43
Today Daily change: -5.0 pips
Today Daily change %: -0.0461%
Today Daily Open: 108.48
Trends:
Previous Daily SMA20: 110.27
Previous Daily SMA50: 112.09
Previous Daily SMA100: 112.2
Previous Daily SMA200: 111.13
Levels:
Previous Daily High: 108.5
Previous Daily Low: 107.77
Previous Weekly High: 110.48
Previous Weekly Low: 104.75
Previous Monthly High: 113.83
Previous Monthly Low: 109.55
Previous Daily Fibonacci 38.2%: 108.22
Previous Daily Fibonacci 61.8%: 108.05
Previous Daily Pivot Point S1: 108
Previous Daily Pivot Point S2: 107.52
Previous Daily Pivot Point S3: 107.28
Previous Daily Pivot Point R1: 108.73
Previous Daily Pivot Point R2: 108.97
Previous Daily Pivot Point R3: 109.45
