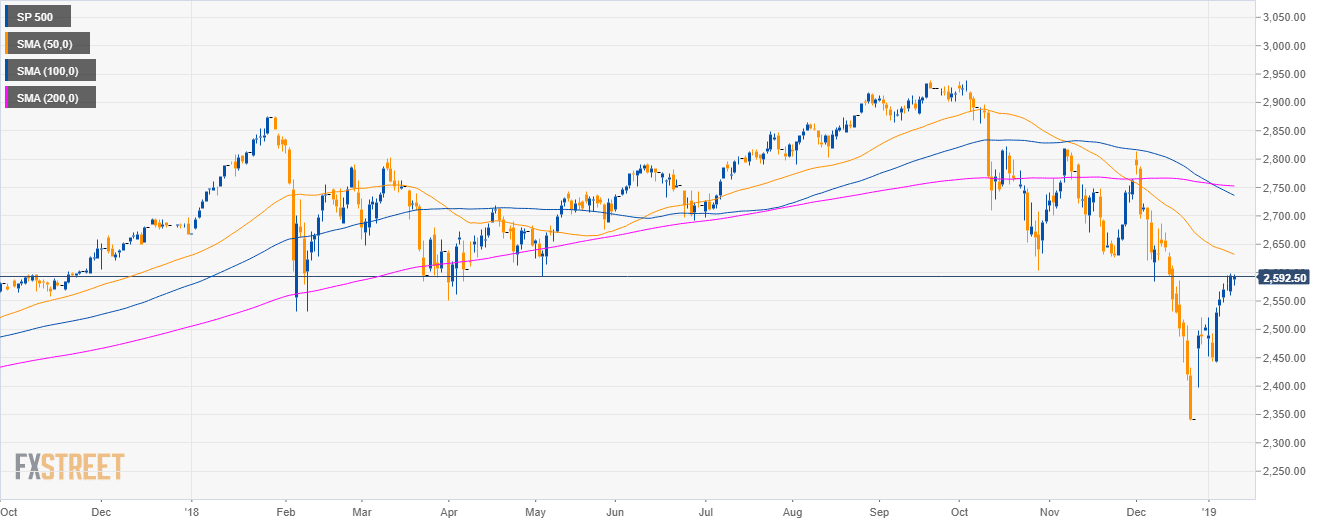
S&P500 daily chart
- The S&P500 is having a deep pullback down below the 200-period simple moving average (SMA).
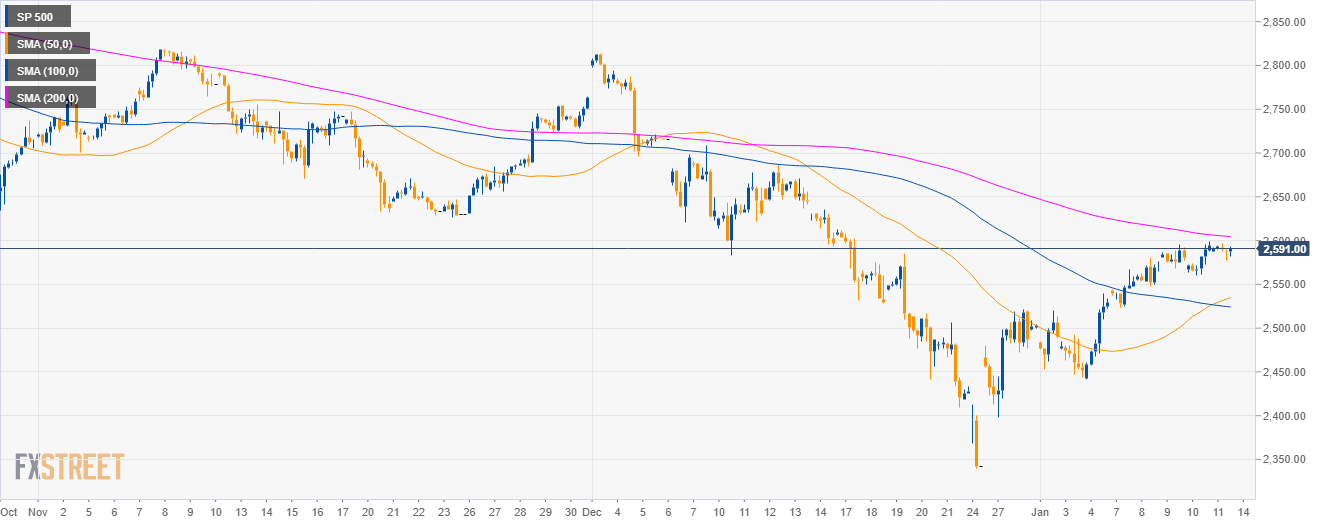
S&P500 4-hour chart
- Bulls reclaimed the 50 and 100 SMAs and are now about to overcome the 200 SMA.
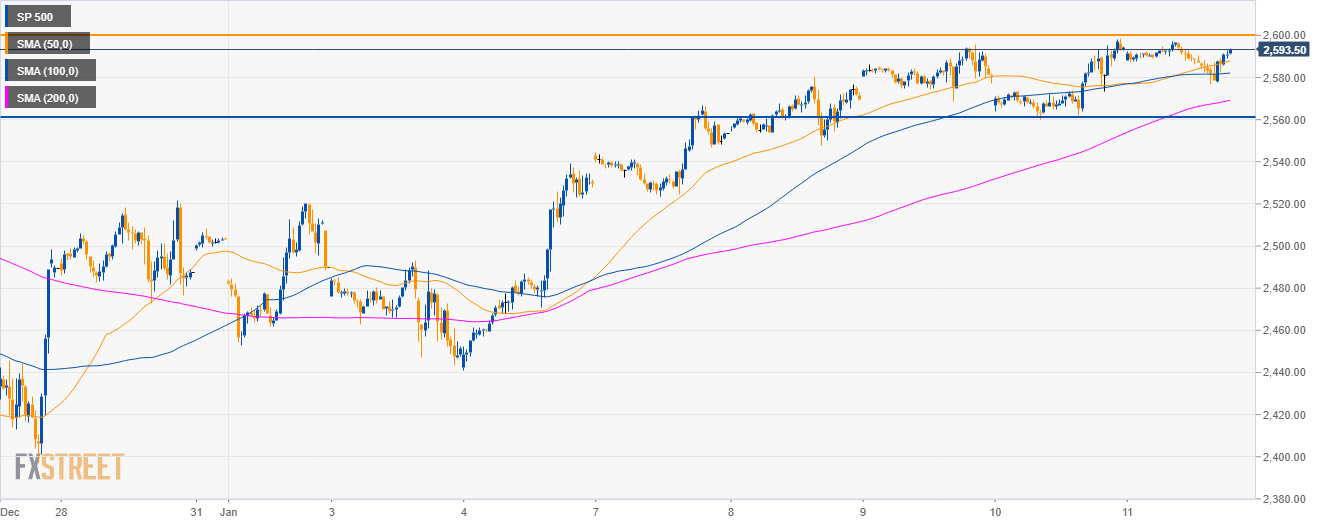
S&P500 30-minute chart
- The market is trading above its main SMAs suggesting bullish momentum.
- A break of the 2,600.00 resistance would lead to a run to the 2,650.00 level.
- Support is seen at the 2,560.00 level.
Additional key levels
SP 500
Overview:
Today Last Price: 2591
Today Daily change: -3.3e+2 pips
Today Daily change %: -0.125%
Today Daily Open: 2594.25
Trends:
Previous Daily SMA20: 2515.84
Previous Daily SMA50: 2634.87
Previous Daily SMA100: 2739.26
Previous Daily SMA200: 2753.15
Levels:
Previous Daily High: 2598.75
Previous Daily Low: 2560.25
Previous Weekly High: 2539
Previous Weekly Low: 2441
Previous Monthly High: 2813.5
Previous Monthly Low: 2340.25
Previous Daily Fibonacci 38.2%: 2584.04
Previous Daily Fibonacci 61.8%: 2574.96
Previous Daily Pivot Point S1: 2570.08
Previous Daily Pivot Point S2: 2545.92
Previous Daily Pivot Point S3: 2531.58
Previous Daily Pivot Point R1: 2608.58
Previous Daily Pivot Point R2: 2622.92
Previous Daily Pivot Point R3: 2647.08
