- DXY is struggling for direction on Monday, looking to prolong the positive momentum for the third session in a row following late last week’s gains.
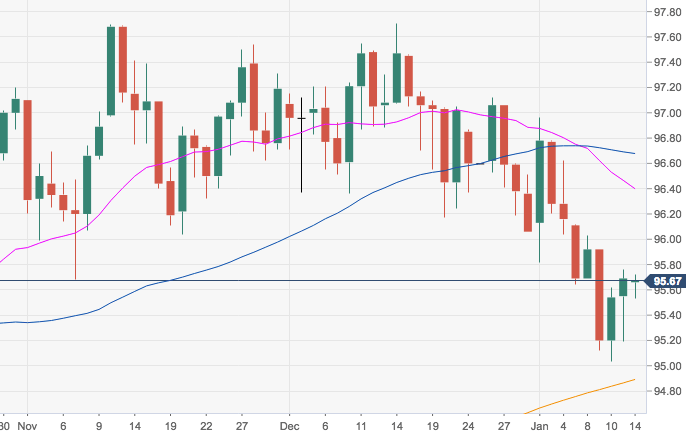
- However, the resumption of the recent downtrend remains a possibility, and with it the likeliness of a re-visit to the critical 200-day SMA at 94.91 ahead of September lows in the 93.80 area.
- On the other hand, downside pressure should mitigate on a surpass of the 95.88/96.00 band.
DXY daily chart
Dollar Index Spot
Overview:
Today Last Price: 95.66
Today Daily change: -3.0 pips
Today Daily change %: -0.0314%
Today Daily Open: 95.69
Trends:
Previous Daily SMA20: 96.44
Previous Daily SMA50: 96.69
Previous Daily SMA100: 96
Previous Daily SMA200: 94.86
Levels:
Previous Daily High: 95.76
Previous Daily Low: 95.19
Previous Weekly High: 96.12
Previous Weekly Low: 95.03
Previous Monthly High: 97.71
Previous Monthly Low: 96.06
Previous Daily Fibonacci 38.2%: 95.54
Previous Daily Fibonacci 61.8%: 95.41
Previous Daily Pivot Point S1: 95.33
Previous Daily Pivot Point S2: 94.98
Previous Daily Pivot Point S3: 94.76
Previous Daily Pivot Point R1: 95.9
Previous Daily Pivot Point R2: 96.12
Previous Daily Pivot Point R3: 96.47
