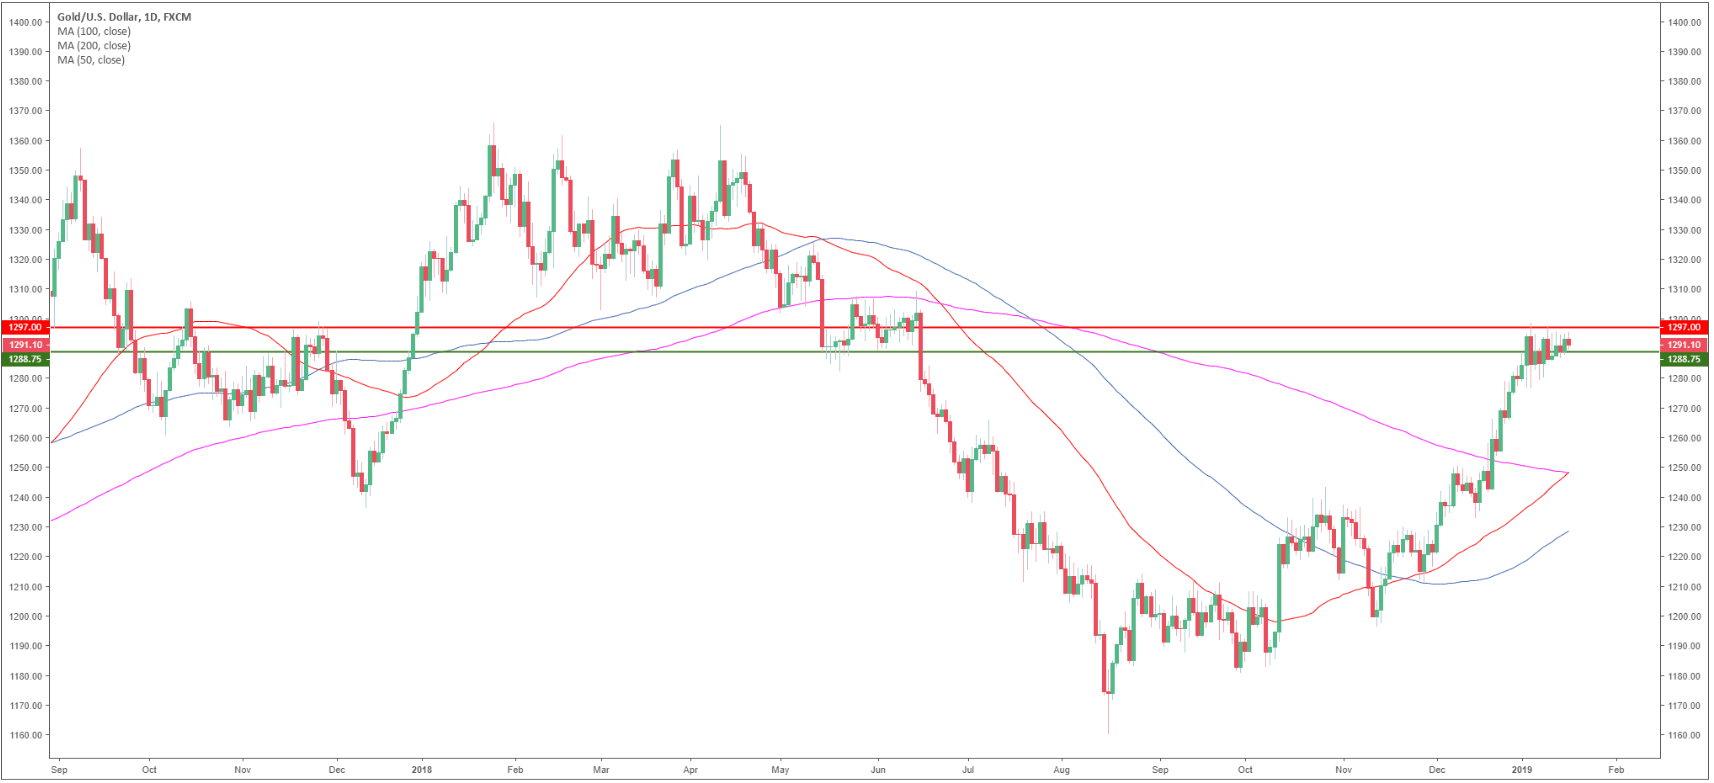
Gold daily chart
- Gold is trading in a bull trend above its main simple moving averages (SMAs).
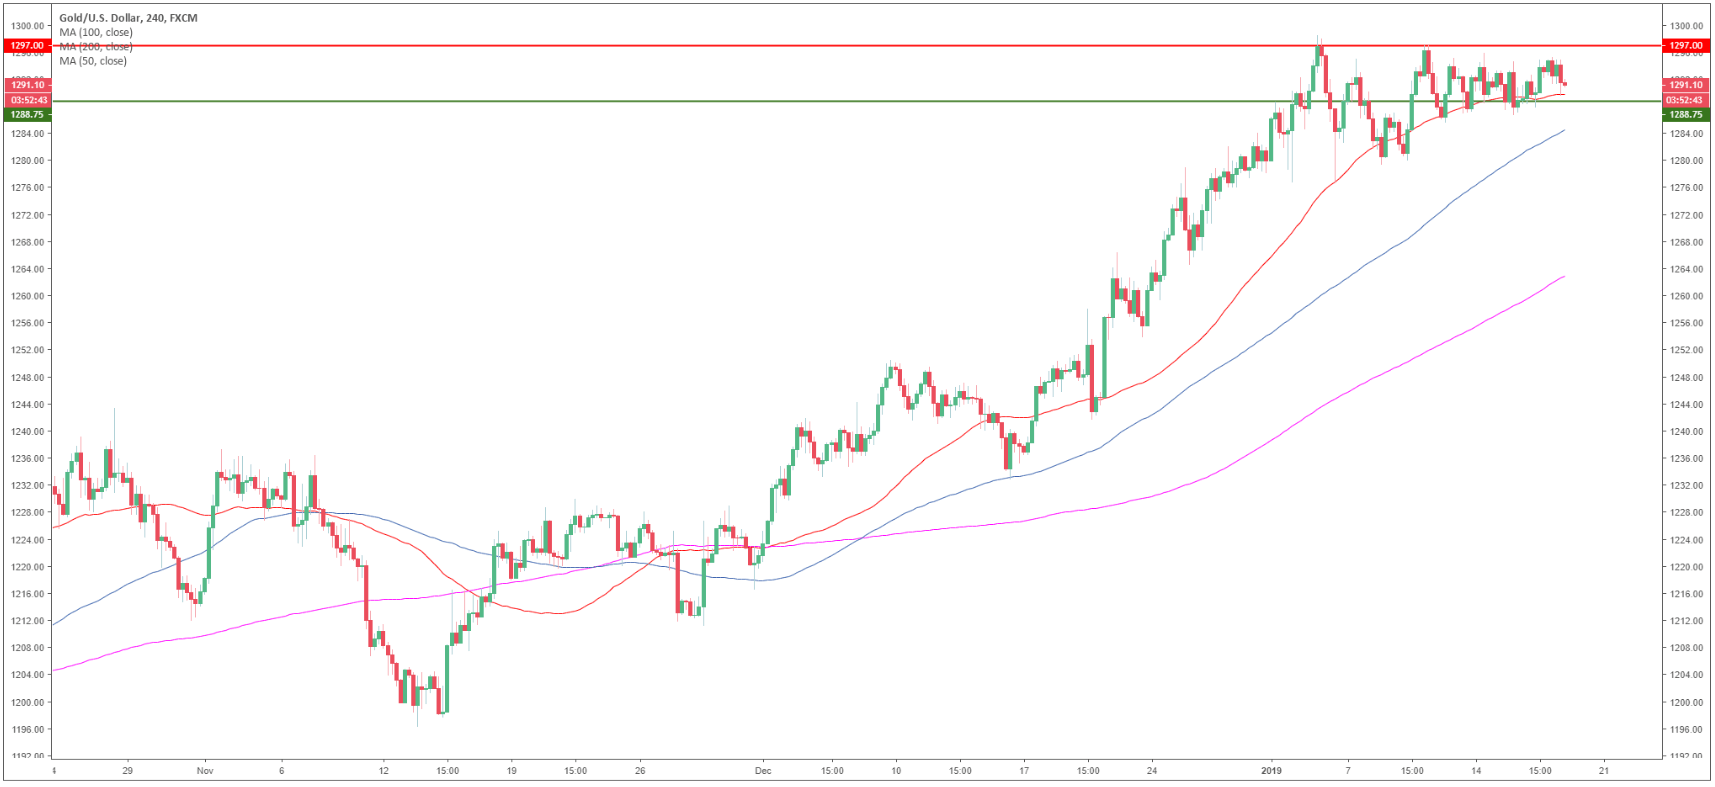
Gold 4-hour chart
- Gold is trading above the main SMAs but currently capped by the 1,297.00 resistance.
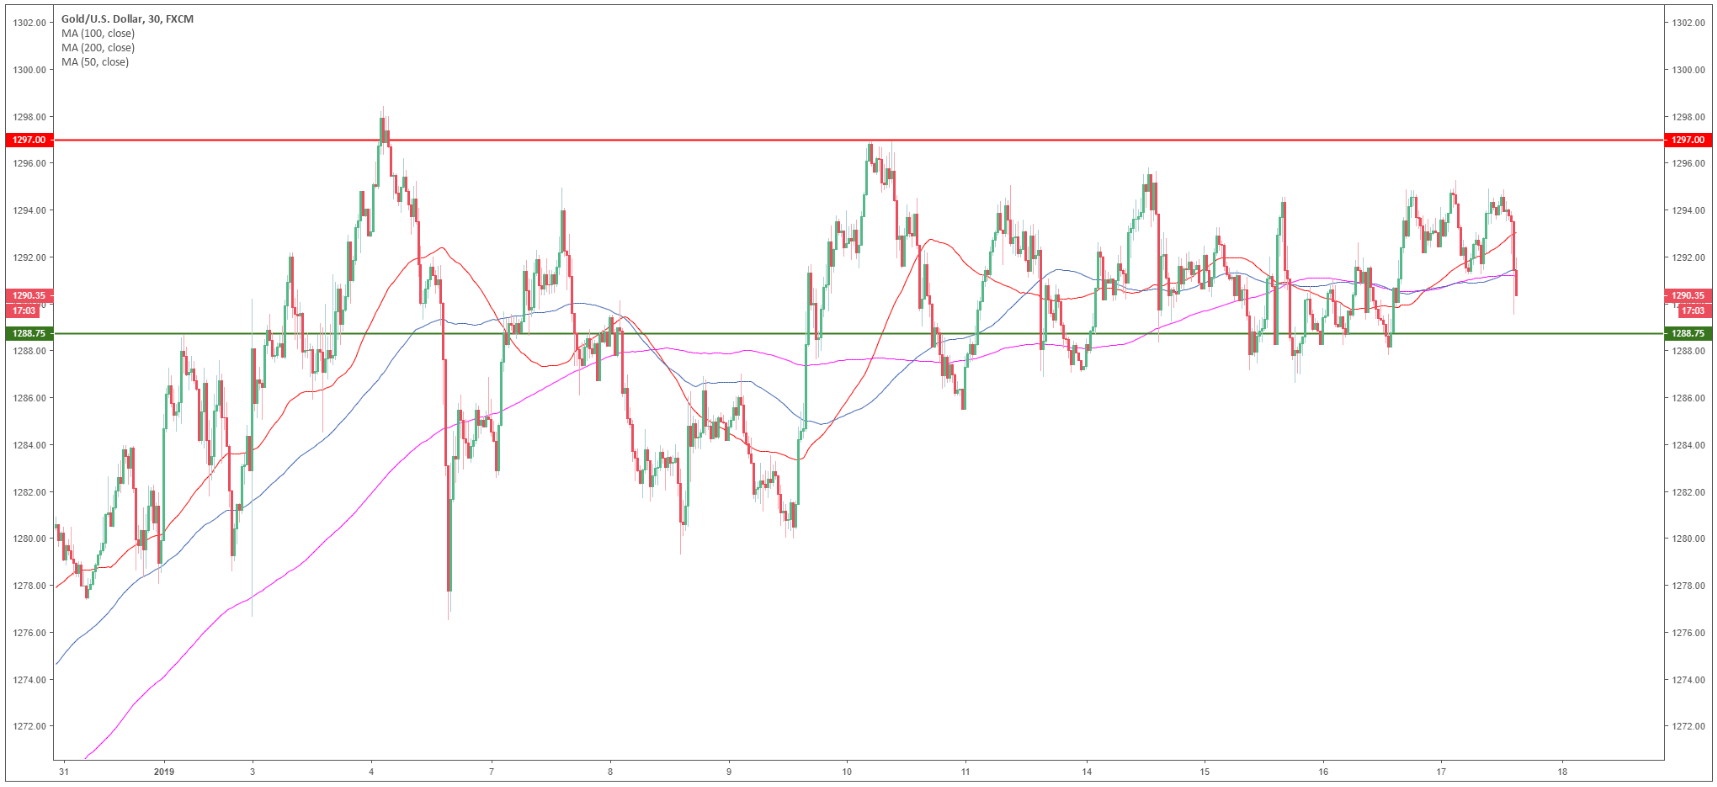
Gold 30-minute chart
- As bears are losing steam below the 50 and 100 SMA, the metal is likely to decline to the 1,288.75 target.
- On the flip side, Resistance is seen at the 1297.00 level.
Additional key levels
XAU/USD
Overview:
Today Last Price: 1291.6
Today Daily change: -150 pips
Today Daily change %: -0.116%
Today Daily Open: 1293.1
Trends:
Daily SMA20: 1281.08
Daily SMA50: 1249.37
Daily SMA100: 1231.38
Daily SMA200: 1228.91
Levels:
Previous Daily High: 1295.25
Previous Daily Low: 1276.2
Previous Weekly High: 1297.15
Previous Weekly Low: 1279.35
Previous Monthly High: 1284.7
Previous Monthly Low: 1221.39
Daily Fibonacci 38.2%: 1287.97
Daily Fibonacci 61.8%: 1283.48
Daily Pivot Point S1: 1281.12
Daily Pivot Point S2: 1269.14
Daily Pivot Point S3: 1262.07
Daily Pivot Point R1: 1300.17
Daily Pivot Point R2: 1307.23
Daily Pivot Point R3: 1319.22
