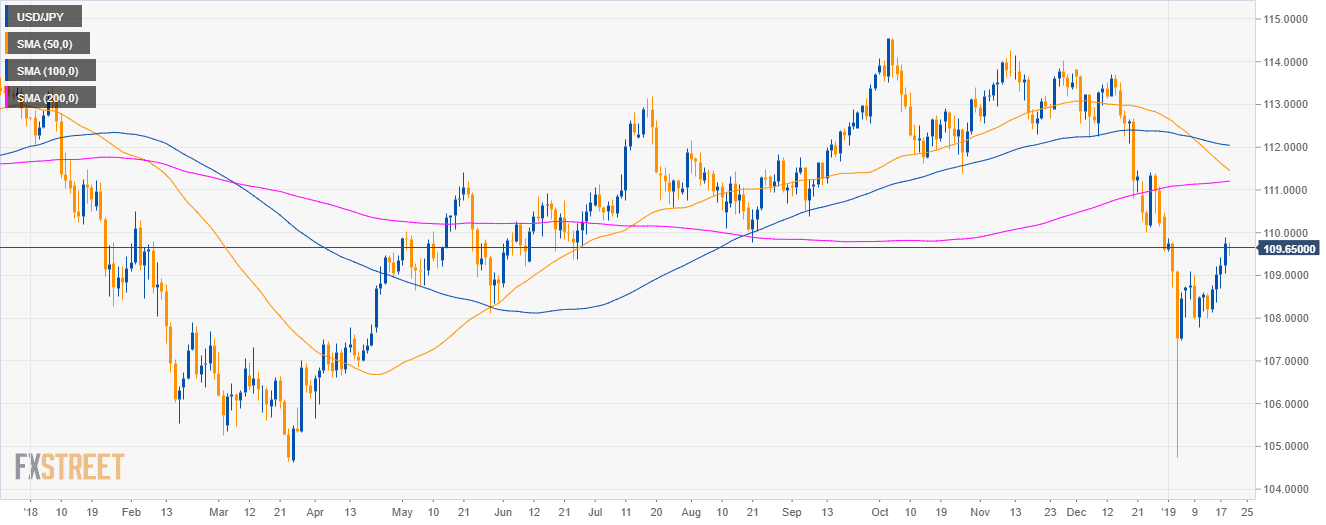
USD/JPY daily chart
- USD/JPY is having a deep pullback below the 50, 100 and 200-period simple moving averages (SMAs).
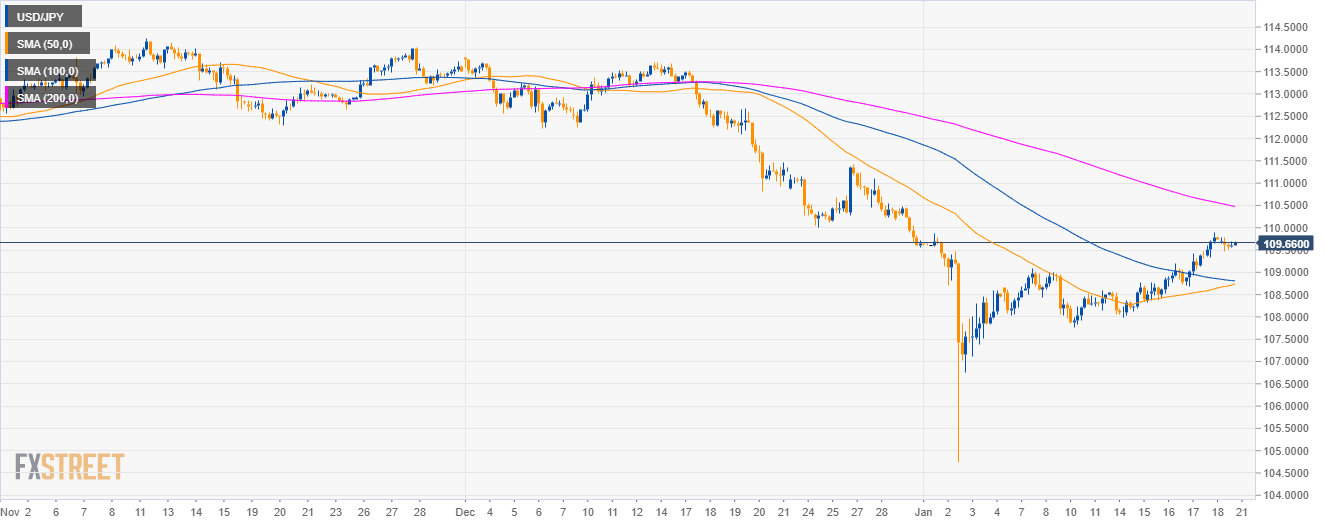
USD/JPY 4-hour chart
- USD/JPY is trading above the 50 and 100 SMA as bulls are challenging the 109.60 level.
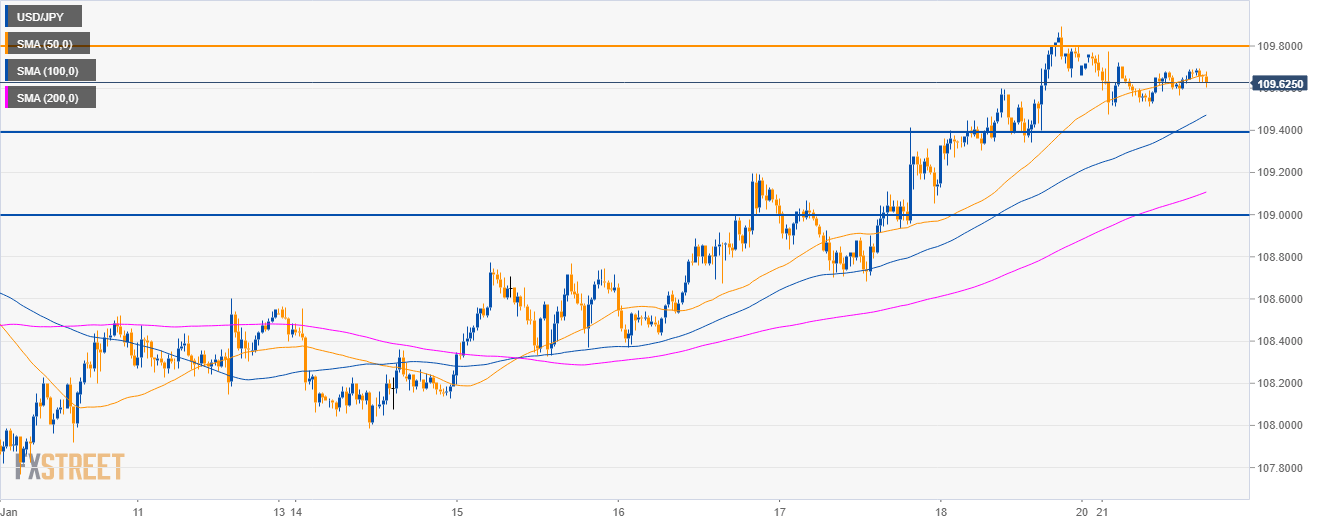
USD/JPY 30-minute chart
- As long as 109.80 caps prices USD/JPY is exposed to retrace to the 109.40 level and the 109.00 level.
- Martin Luther King Day, will likely see limited movements in the forex market.
Additional key levels
USD/JPY
Overview:
Today Last Price: 109.65
Today Daily change: -0.10 pips
Today Daily change %: -0.09%
Today Daily Open: 109.75
Trends:
Daily SMA20: 109.25
Daily SMA50: 111.54
Daily SMA100: 112.06
Daily SMA200: 111.19
Levels:
Previous Daily High: 109.9
Previous Daily Low: 109.06
Previous Weekly High: 109.9
Previous Weekly Low: 107.99
Previous Monthly High: 113.83
Previous Monthly Low: 109.55
Daily Fibonacci 38.2%: 109.57
Daily Fibonacci 61.8%: 109.38
Daily Pivot Point S1: 109.24
Daily Pivot Point S2: 108.73
Daily Pivot Point S3: 108.4
Daily Pivot Point R1: 110.08
Daily Pivot Point R2: 110.41
Daily Pivot Point R3: 110.92
