“¢ The pair has been steadily recovering from the vicinity of 100-day SMA support, or over one-month lows and the up-move has been along an ascending trend-channel on the 1-hourly chart.
“¢ However, given the recent sharp decline from over 19-month tops, the said channel seems to have constituted towards the formation of a bearish continuation flag chart pattern.
USD/CAD 1-hourly chart
-636837552337351946.png)
“¢ Moreover, this month’s decisive break below 50-EMA/ascending trend-line confluence support adds credence to the bearish set-up and suggests some more downside in the near-term.
“¢ Despite the negative outlook, traders are likely to wait for a convincing breakthrough the ascending trend-channel support before positioning for additional declines back to sub-1.3200 level.
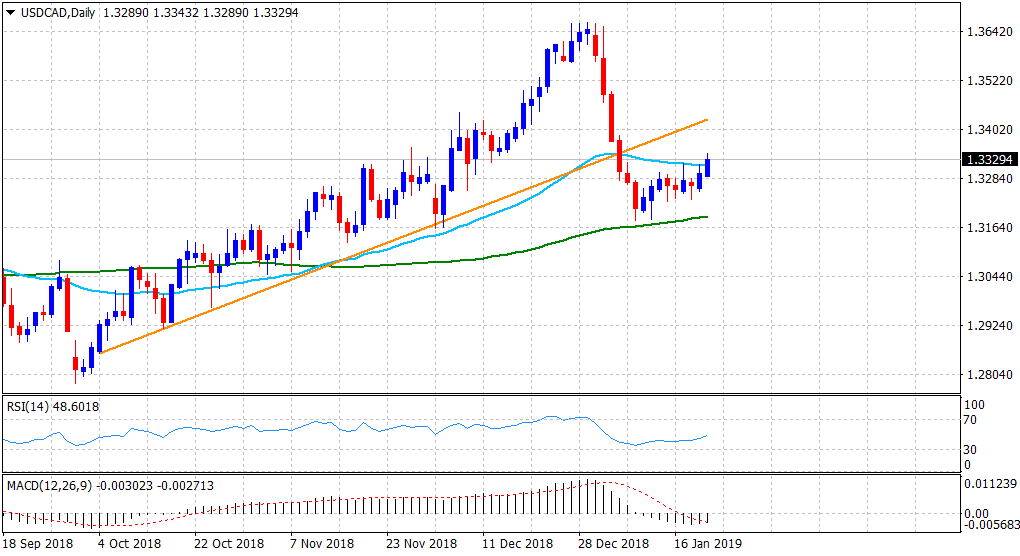
USD/CAD
Overview:
Today Last Price: 1.3329
Today Daily change %: 0.23%
Today Daily Open: 1.3298
Trends:
Daily SMA20: 1.3432
Daily SMA50: 1.337
Daily SMA100: 1.3205
Daily SMA200: 1.3105
Levels:
Previous Daily High: 1.3319
Previous Daily Low: 1.3252
Previous Weekly High: 1.332
Previous Weekly Low: 1.3226
Previous Monthly High: 1.4134
Previous Monthly Low: 1.316
Daily Fibonacci 38.2%: 1.3293
Daily Fibonacci 61.8%: 1.3277
Daily Pivot Point S1: 1.326
Daily Pivot Point S2: 1.3222
Daily Pivot Point S3: 1.3193
Daily Pivot Point R1: 1.3327
Daily Pivot Point R2: 1.3356
Daily Pivot Point R3: 1.3394
