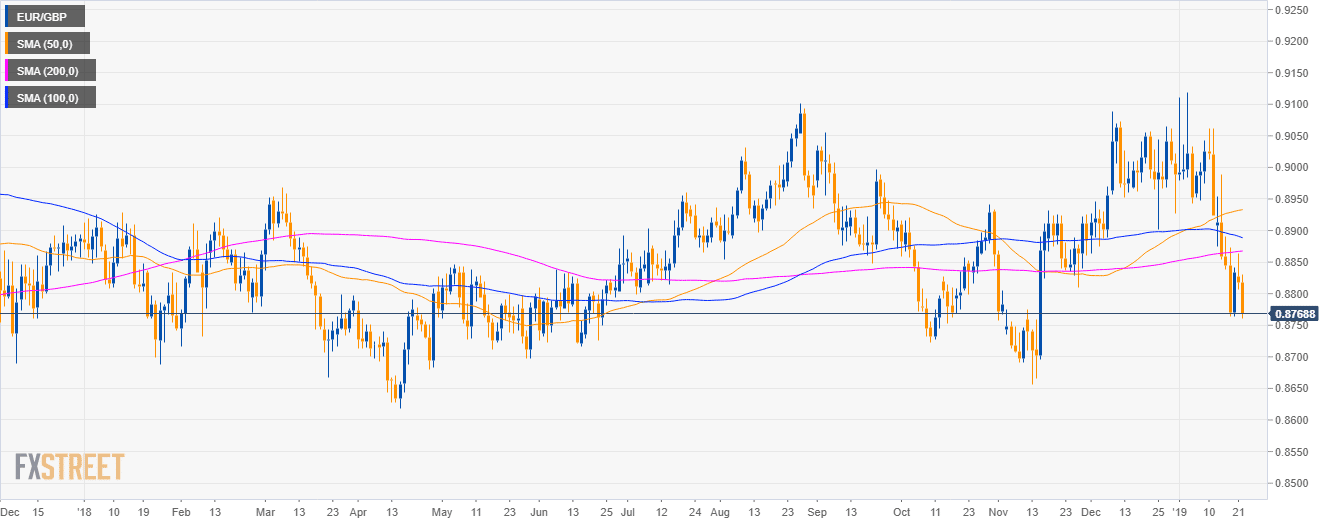
EUR/GBP daily chart
- EUR/GBP is trading in a sideways trend below the 50, 100 and 200-day simple moving averages (SMAs).
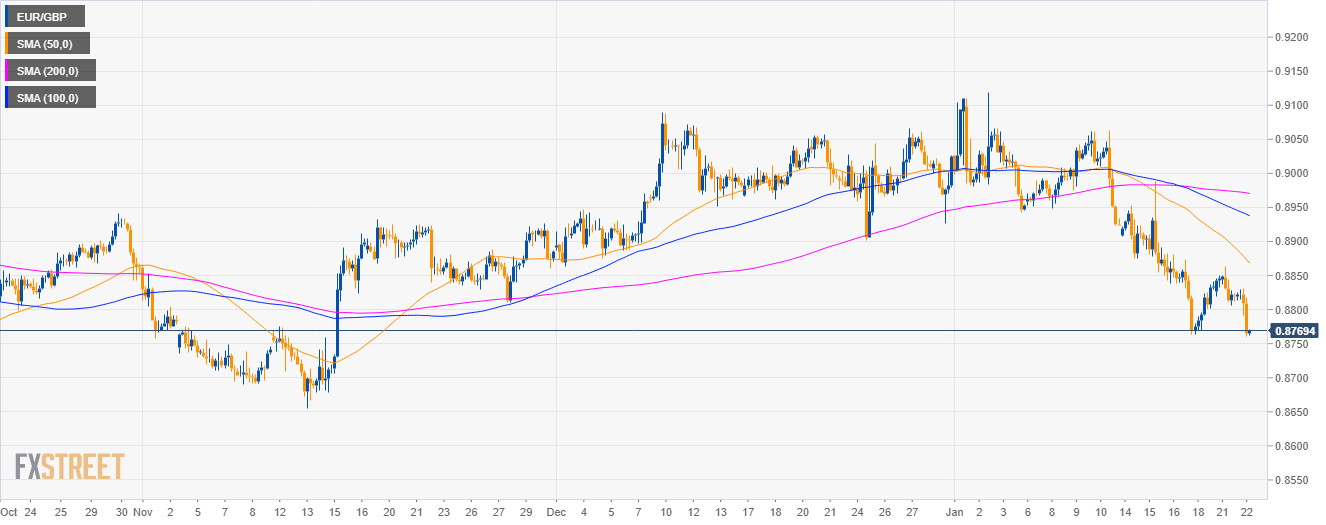
EUR/GBP 4-hour chart
- EUR/GBP is trading below its main SMAs as the currency cross is trading at the 2019 lows.
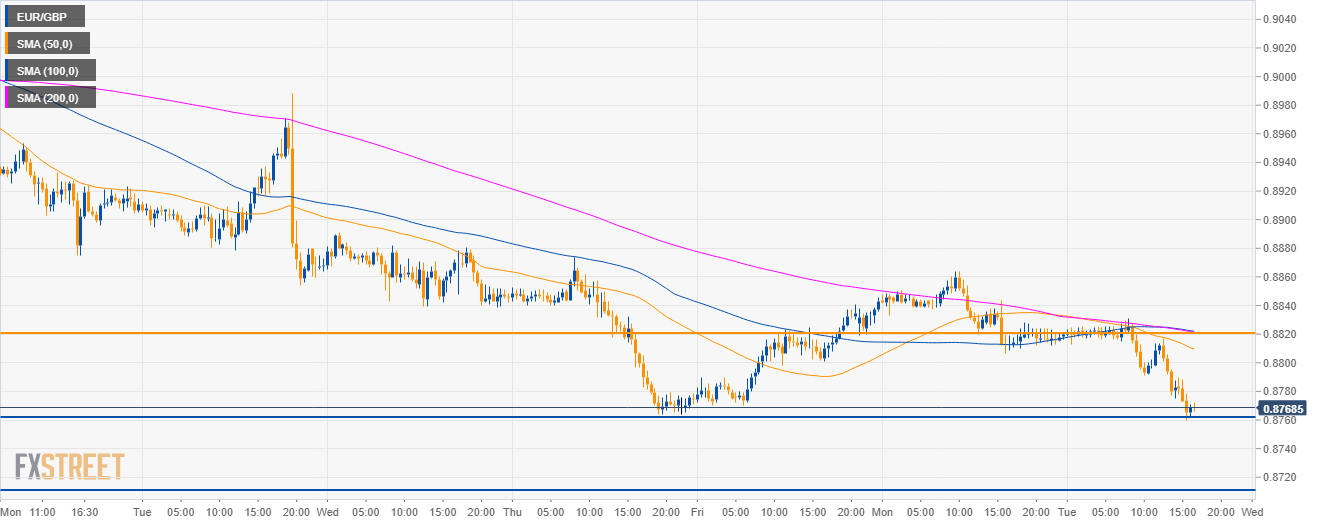
EUR/GBP 30-minute chart
- EUR/GBP bears drove the market to the 0.8760 support as the GBP is gaining strength across the board.
- As the market is testing last Thursday low, bulls might step in for a run to the 0.8820 level.
- If 0.8760 support fails to hold prices then a drop to 0.8710 can be on the cards for sellers.
Additional key levels
EUR/GBP
Overview:
Today Last Price: 0.8768
Today Daily change: 49 pips
Today Daily change %: -0.56%
Today Daily Open: 0.8817
Trends:
Daily SMA20: 0.8948
Daily SMA50: 0.8932
Daily SMA100: 0.8891
Daily SMA200: 0.8866
Levels:
Previous Daily High: 0.8864
Previous Daily Low: 0.8806
Previous Weekly High: 0.8988
Previous Weekly Low: 0.8764
Previous Monthly High: 0.9089
Previous Monthly Low: 0.8863
Daily Fibonacci 38.2%: 0.8828
Daily Fibonacci 61.8%: 0.8842
Daily Pivot Point S1: 0.8795
Daily Pivot Point S2: 0.8772
Daily Pivot Point S3: 0.8737
Daily Pivot Point R1: 0.8852
Daily Pivot Point R2: 0.8887
Daily Pivot Point R3: 0.891
