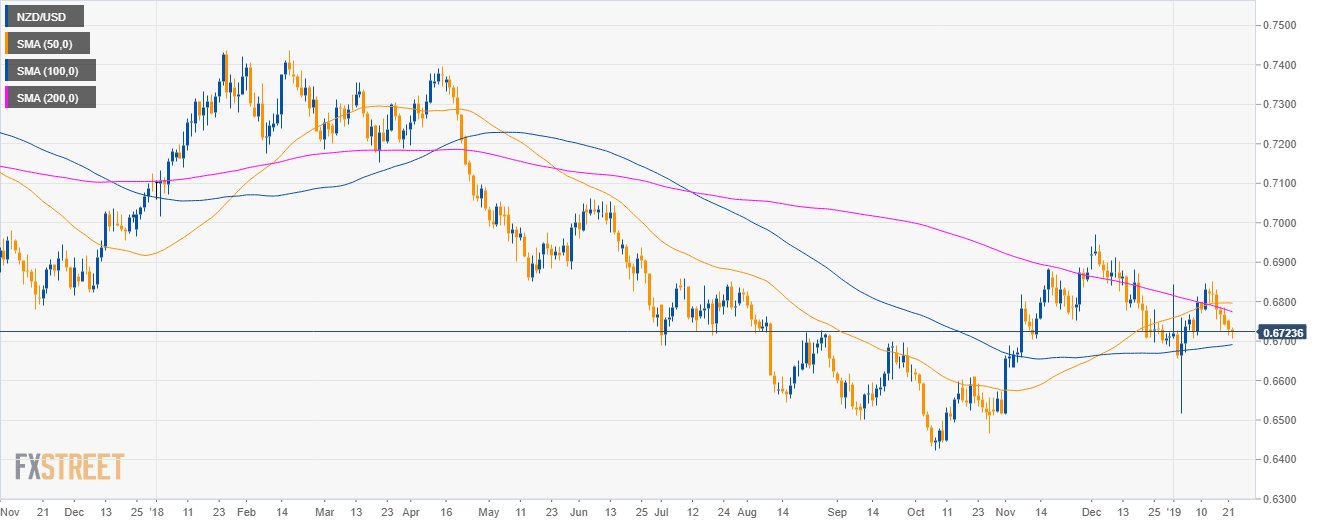
NZD/USD daily chart
- NZD/USD is trading in a bear trend below the 50, 100 and 200-day simple moving averages (SMAs).
- In New Zealand, the Consumer Price Index (CPI) Q4 will be released at 22.45 GMT.
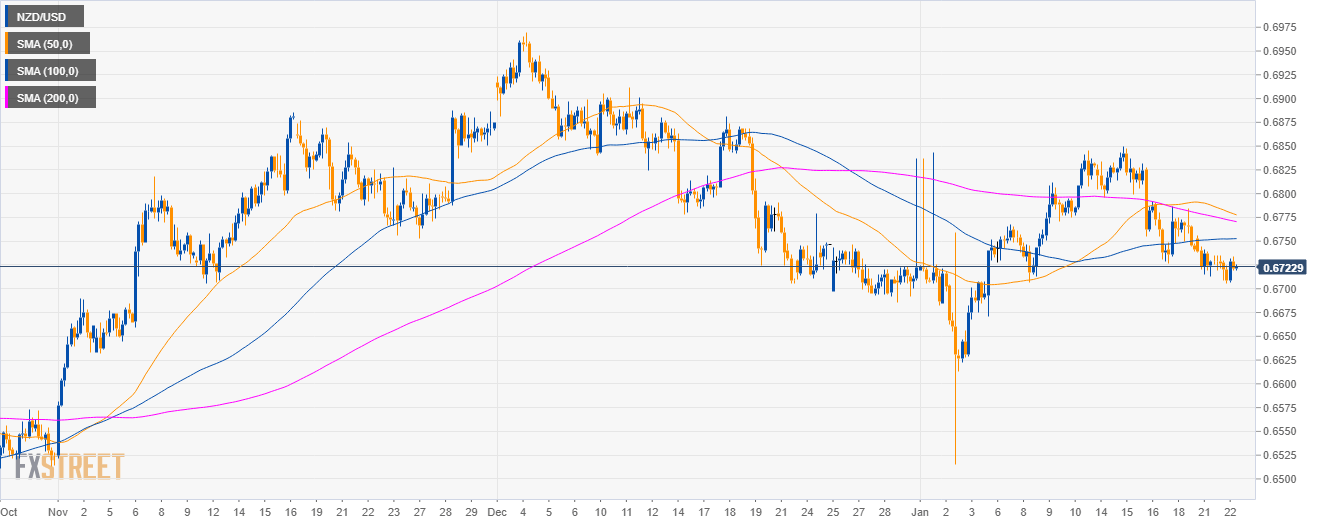
NZD/USD 4-hour chart
- NZD/USD is trading below the main SMAs as the market is testing the 0.6700 figure.
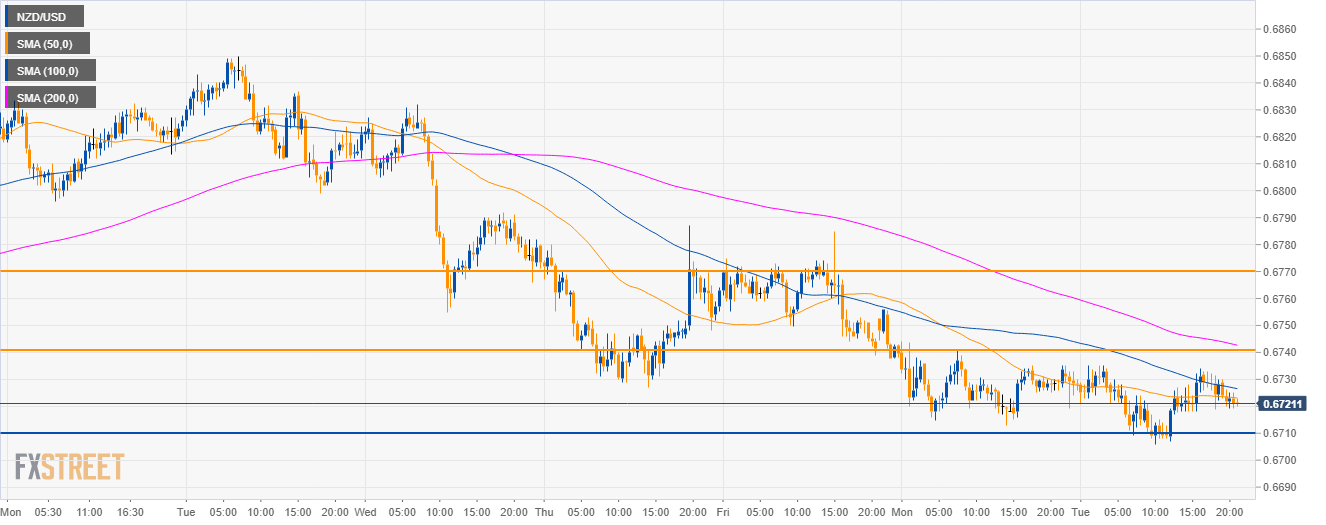
NZD/USD 30-minute chart
- The NZD/USD currency pair is trading below its main SMAs suggesting bearish momentum.
- Support to the downside can come in at 0.6710, 0.6680 and the 0.6640.
- To the upside, resistance is seen near 0.6740 and the 0.6770 level.
Additional key levels
NZD/USD
Overview:
Today Last Price: 0.6721
Today Daily change: -0.0008 pips
Today Daily change %: -0.12%
Today Daily Open: 0.6729
Trends:
Daily SMA20: 0.6747
Daily SMA50: 0.6797
Daily SMA100: 0.6689
Daily SMA200: 0.678
Levels:
Previous Daily High: 0.6756
Previous Daily Low: 0.6713
Previous Weekly High: 0.685
Previous Weekly Low: 0.6727
Previous Monthly High: 0.697
Previous Monthly Low: 0.6686
Daily Fibonacci 38.2%: 0.6729
Daily Fibonacci 61.8%: 0.674
Daily Pivot Point S1: 0.6709
Daily Pivot Point S2: 0.669
Daily Pivot Point S3: 0.6666
Daily Pivot Point R1: 0.6752
Daily Pivot Point R2: 0.6775
Daily Pivot Point R3: 0.6795
