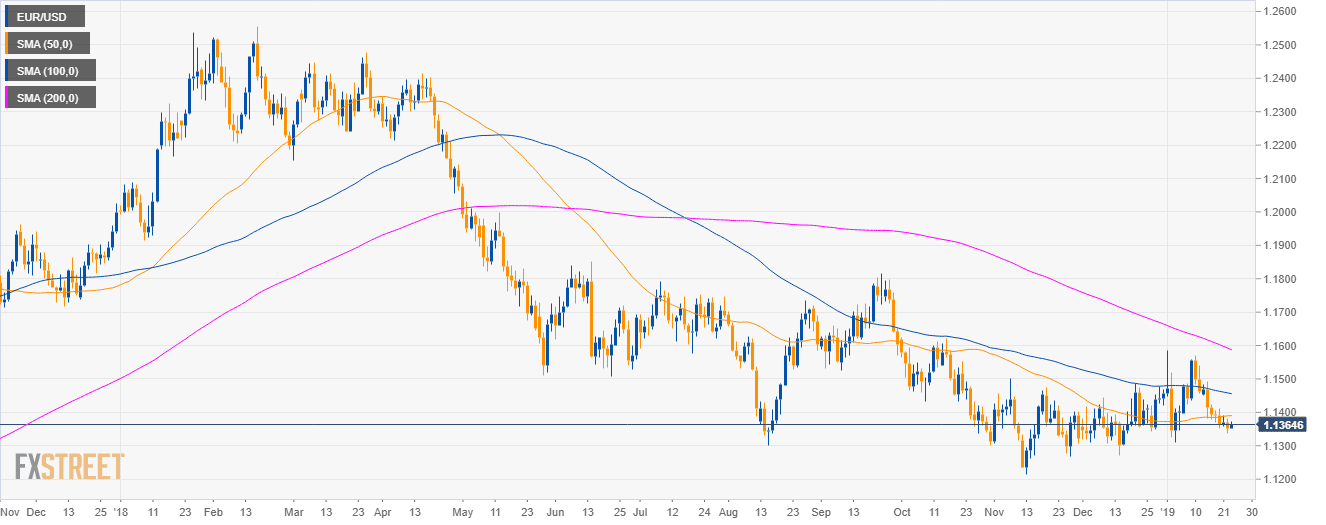
EUR/USD daily chart
- EUR/USD is trading in a bear trend below the 50, 100 and 200-day simple moving averages (SMAs).
- The European Central Bank (ECB) rate decision and its press conference can lead to high volatility in the forex market this Thursday.
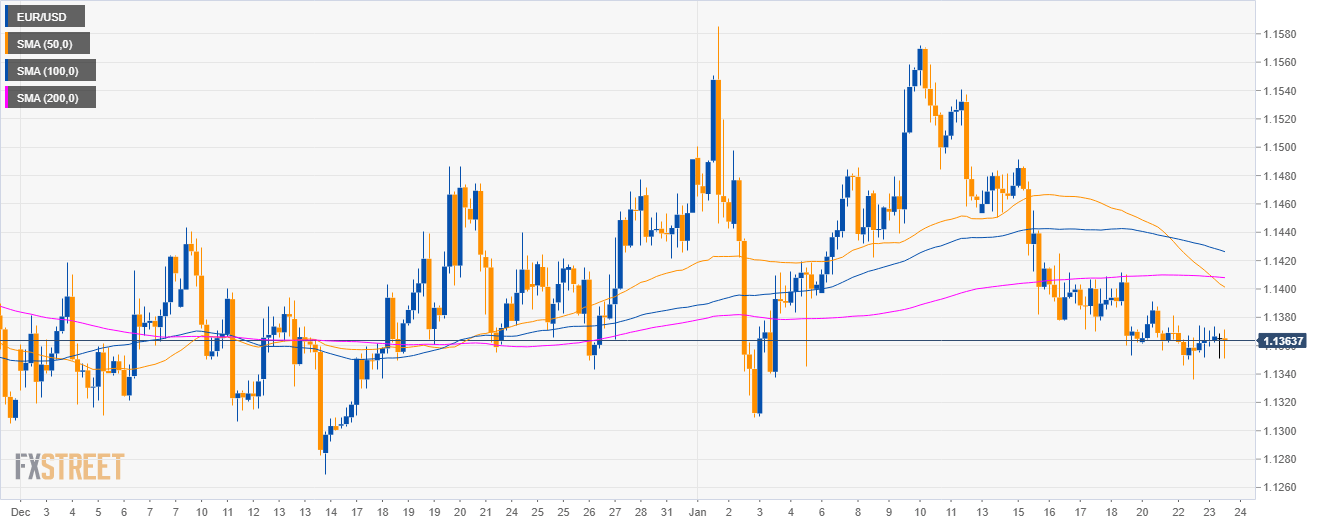
EUR/USD 4-hour chart
- EUR/USD is trading below the main SMAs near the 2019 low.
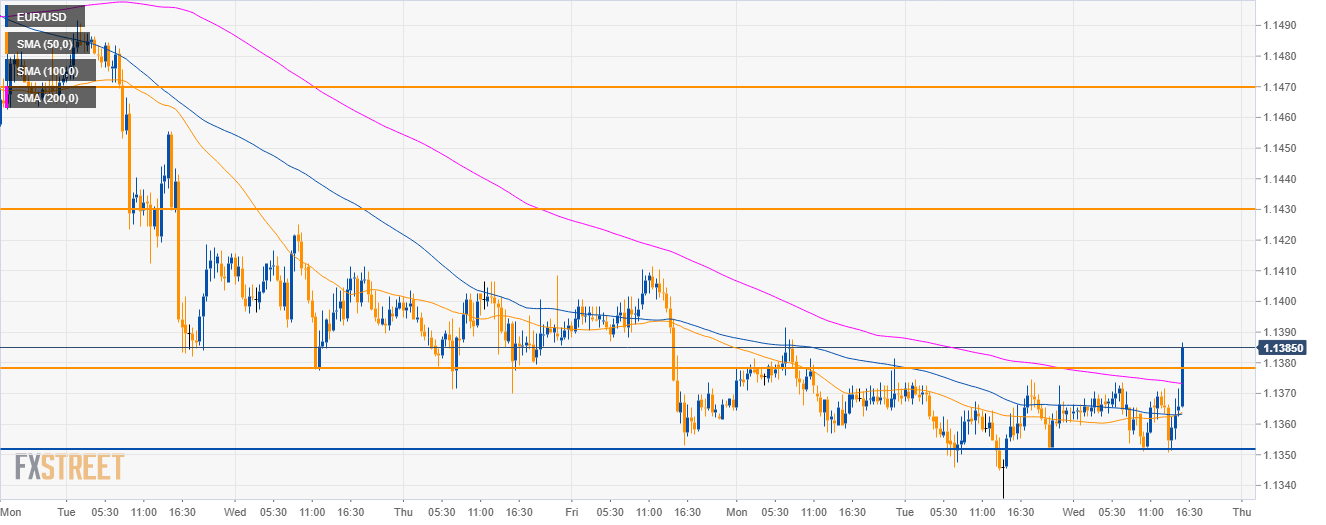
EUR/GBP 30-minute chart
- EUR/USD is stabilizing near the 1.1350 level.
- The sellers seem rather reluctant to continue the downtrend as bulls are challenging the 1.1380 level.
- The 1.1430 and 1.1470 levels are seen as bullish target to the upside in the coming sessions.
Additional key levels
EUR/USD
Overview:
Today Last Price: 1.1366
Today Daily change: 14 pips
Today Daily change %: 0.12%
Today Daily Open: 1.1352
Trends:
Daily SMA20: 1.1425
Daily SMA50: 1.139
Daily SMA100: 1.1458
Daily SMA200: 1.1594
Levels:
Previous Daily High: 1.1382
Previous Daily Low: 1.1336
Previous Weekly High: 1.1491
Previous Weekly Low: 1.1353
Previous Monthly High: 1.1486
Previous Monthly Low: 1.1269
Daily Fibonacci 38.2%: 1.1353
Daily Fibonacci 61.8%: 1.1364
Daily Pivot Point S1: 1.1332
Daily Pivot Point S2: 1.1311
Daily Pivot Point S3: 1.1286
Daily Pivot Point R1: 1.1377
Daily Pivot Point R2: 1.1402
Daily Pivot Point R3: 1.1423
