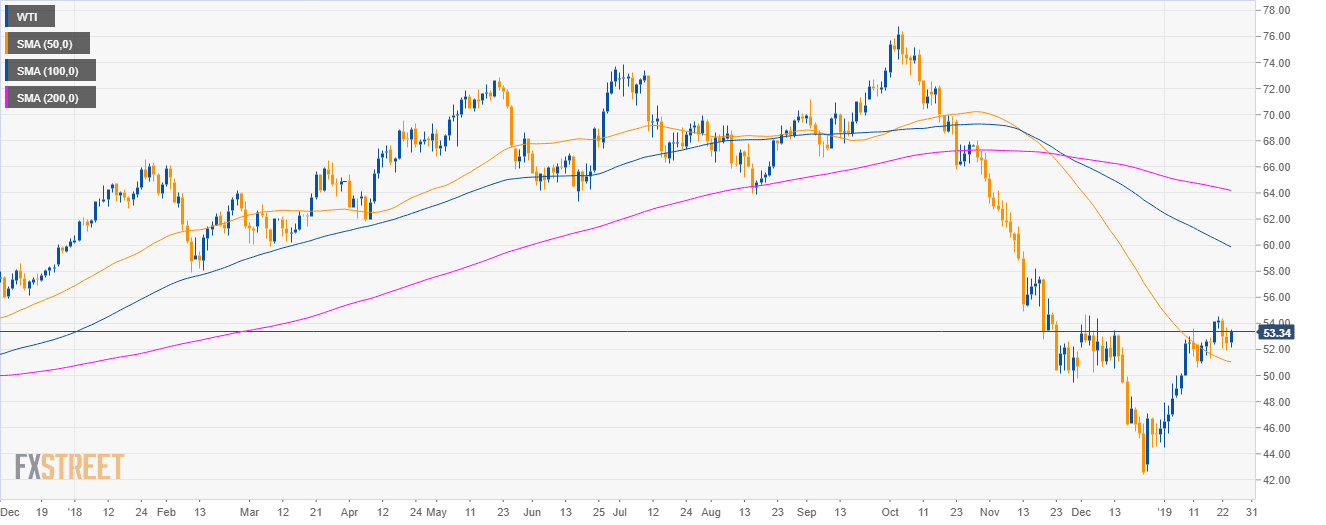
Oil daily chart
- Crude oil WTI is trading in a bear trend below the 100 and 200-day simple moving averages (SMAs).
- Bulls have recaptured the 50 SMA.
- As discussed, bulls hit the 53.00 figure.
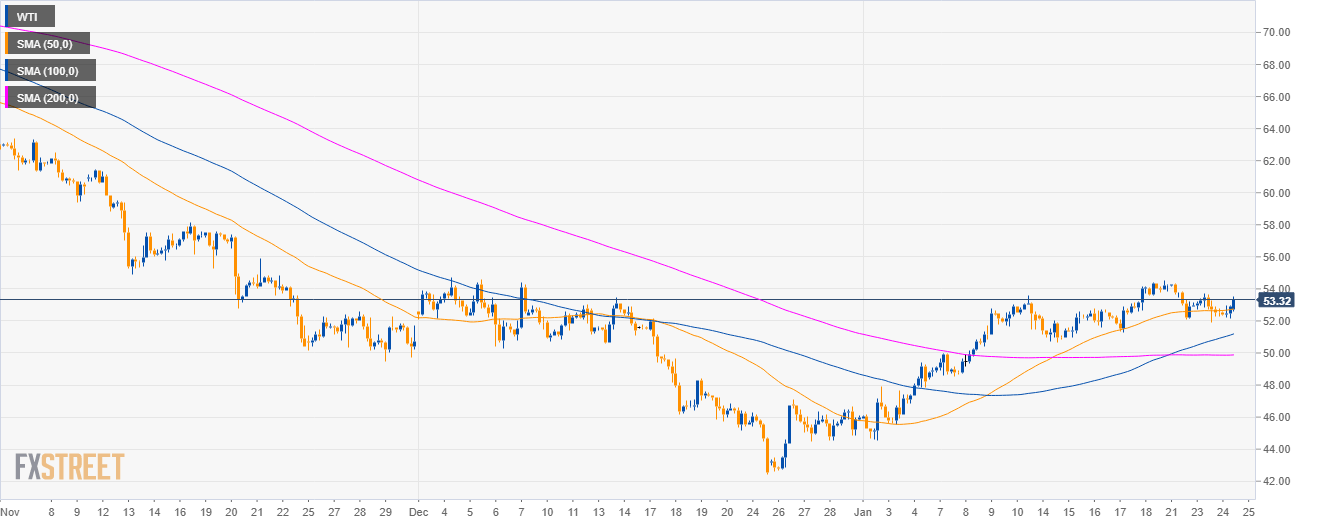
Oil 4-hour chart
- The market is trading above its main SMAs suggesting bullish momentum.
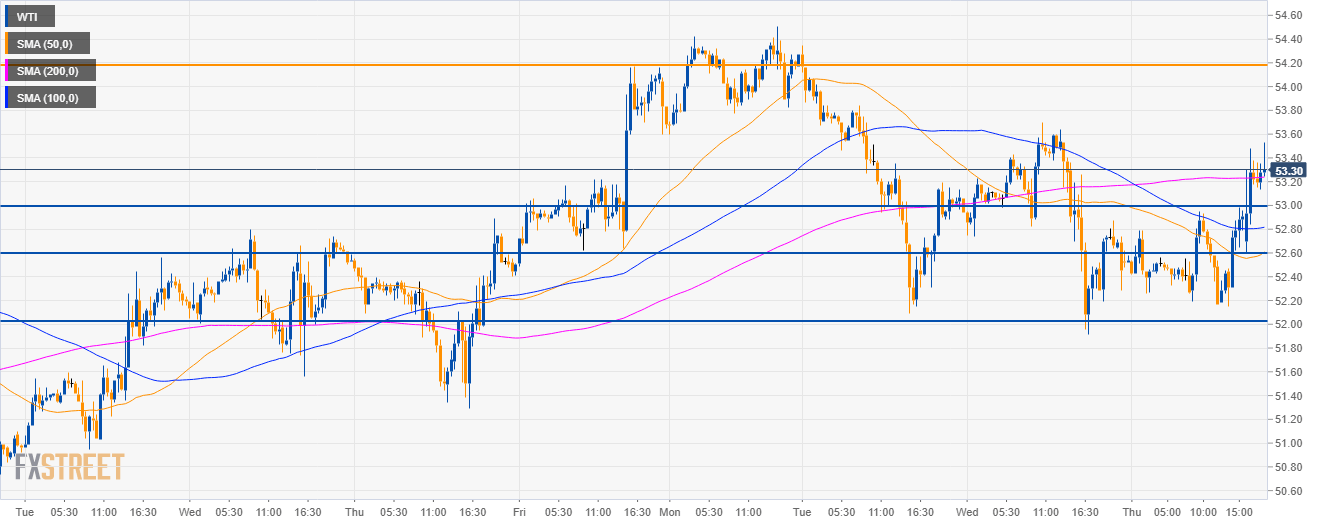
Oil 30-minute chart
- As bulls are trading above the main SMAs, buyers will try to lift the market to 54.20 resistance.
- Support to the downside is seen at the 53.00 and 52.60 level.
Additional key levels
WTI
Overview:
Today Last Price: 53.38
Today Daily change: 93 pips
Today Daily change %: 1.77%
Today Daily Open: 52.45
Trends:
Daily SMA20: 50.44
Daily SMA50: 50.71
Daily SMA100: 59.2
Daily SMA200: 63.88
Levels:
Previous Daily High: 53.7
Previous Daily Low: 51.91
Previous Weekly High: 54.17
Previous Weekly Low: 50.65
Previous Monthly High: 54.68
Previous Monthly Low: 42.45
Daily Fibonacci 38.2%: 52.59
Daily Fibonacci 61.8%: 53.02
Daily Pivot Point S1: 51.67
Daily Pivot Point S2: 50.9
Daily Pivot Point S3: 49.88
Daily Pivot Point R1: 53.46
Daily Pivot Point R2: 54.48
Daily Pivot Point R3: 55.25
