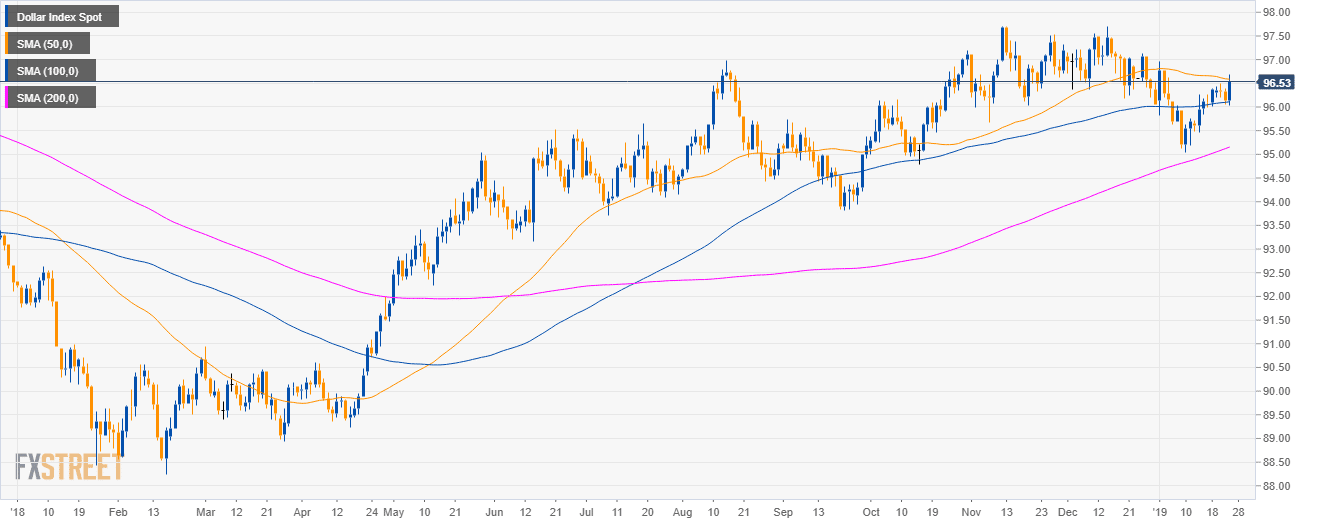
DXY daily chart
- The US Dollar Index (DXY) is in a bull trend above 200-day simple moving average (SMA).
- Bears have momentarily retaken the 50 SMA as the bulls pushed the market above the 96.50 resistance.
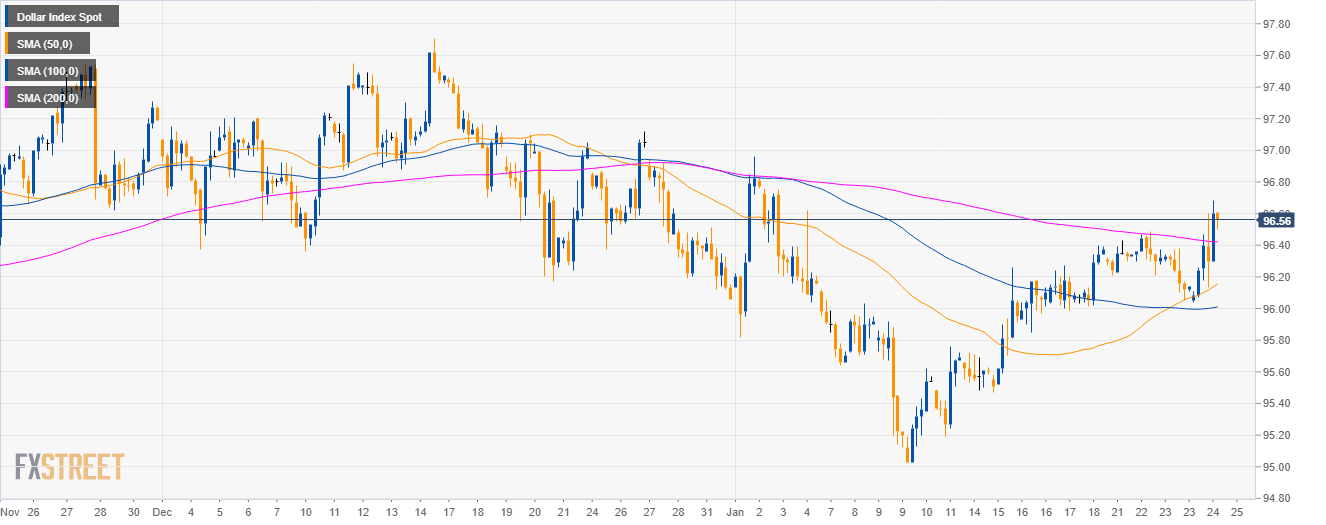
DXY 4-hour chart
- The market broke above the main SMAs suggesting bullish momentum in the medium-term.
- DXY bulls are very close to the 2019 high.
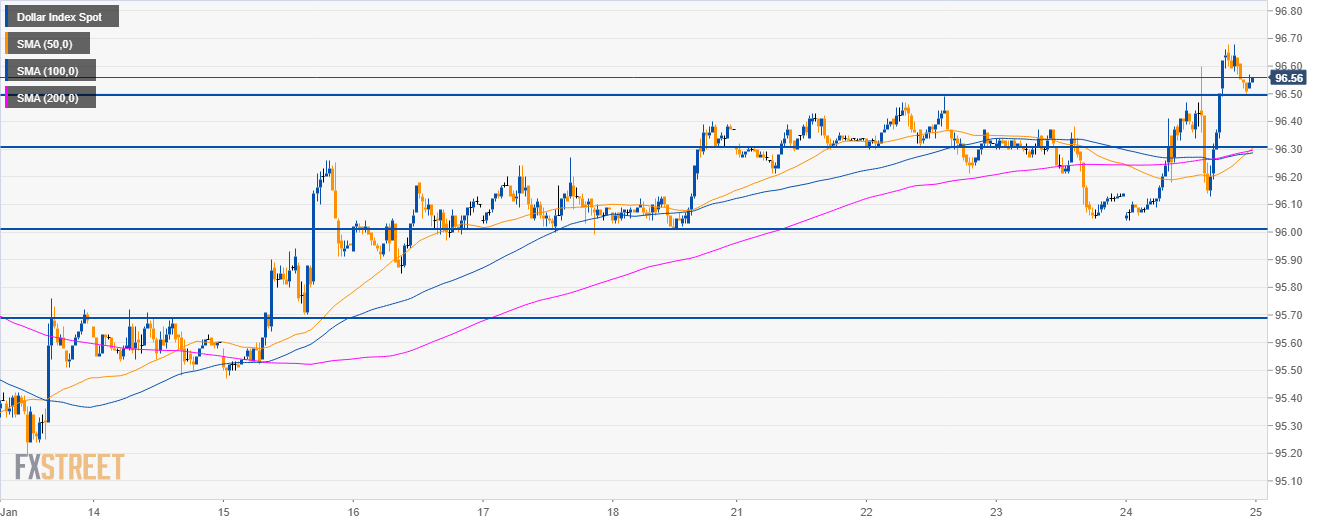
DXY 30-minute chart
- If bears bring the market below the 96.50 level, the market should decline towards 96.00.
- When 96.00 figure gets broken to the downside, the market should continue its fall towards 95.70 bear target.
- Resistance to the upside is seen at the 95.70 level.
Additional key levels
Dollar Index Spot
Overview:
Today Last Price: 96.56
Today Daily change: 43 pips
Today Daily change %: 0.45%
Today Daily Open: 96.13
Trends:
Daily SMA20: 96.11
Daily SMA50: 96.6
Daily SMA100: 96.1
Daily SMA200: 95.12
Levels:
Previous Daily High: 96.38
Previous Daily Low: 96.05
Previous Weekly High: 96.4
Previous Weekly Low: 95.47
Previous Monthly High: 97.71
Previous Monthly Low: 96.06
Daily Fibonacci 38.2%: 96.18
Daily Fibonacci 61.8%: 96.25
Daily Pivot Point S1: 95.99
Daily Pivot Point S2: 95.86
Daily Pivot Point S3: 95.66
Daily Pivot Point R1: 96.32
Daily Pivot Point R2: 96.52
Daily Pivot Point R3: 96.65
