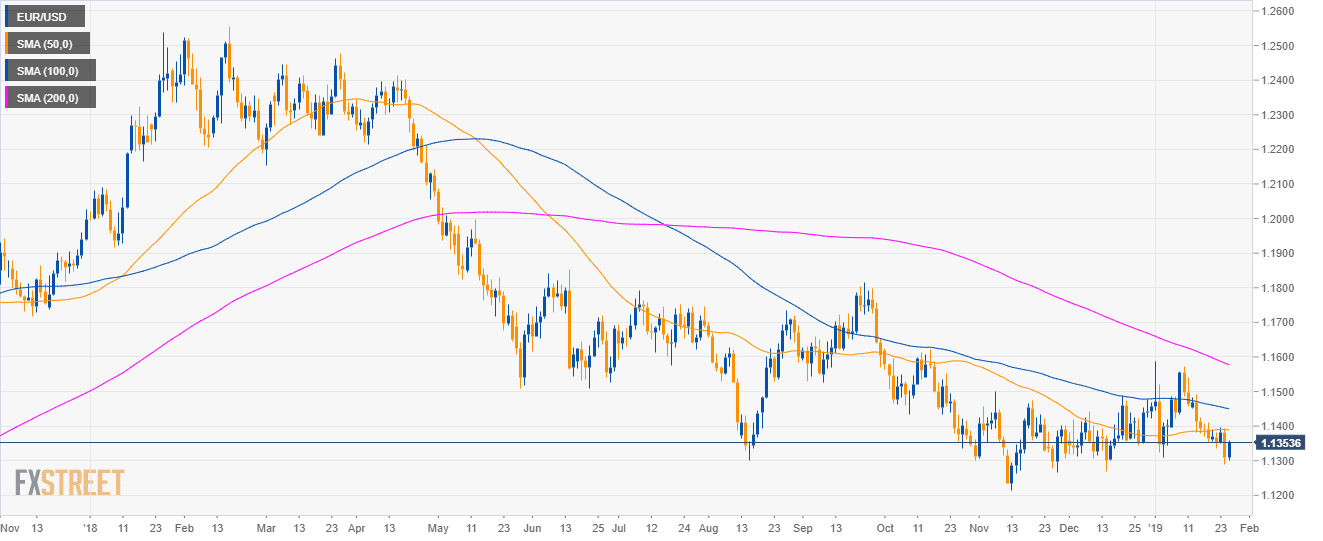
EUR/USD daily chart
- EUR/USD is trading in a bear trend below the 50, 100 and 200-day simple moving averages (SMAs).
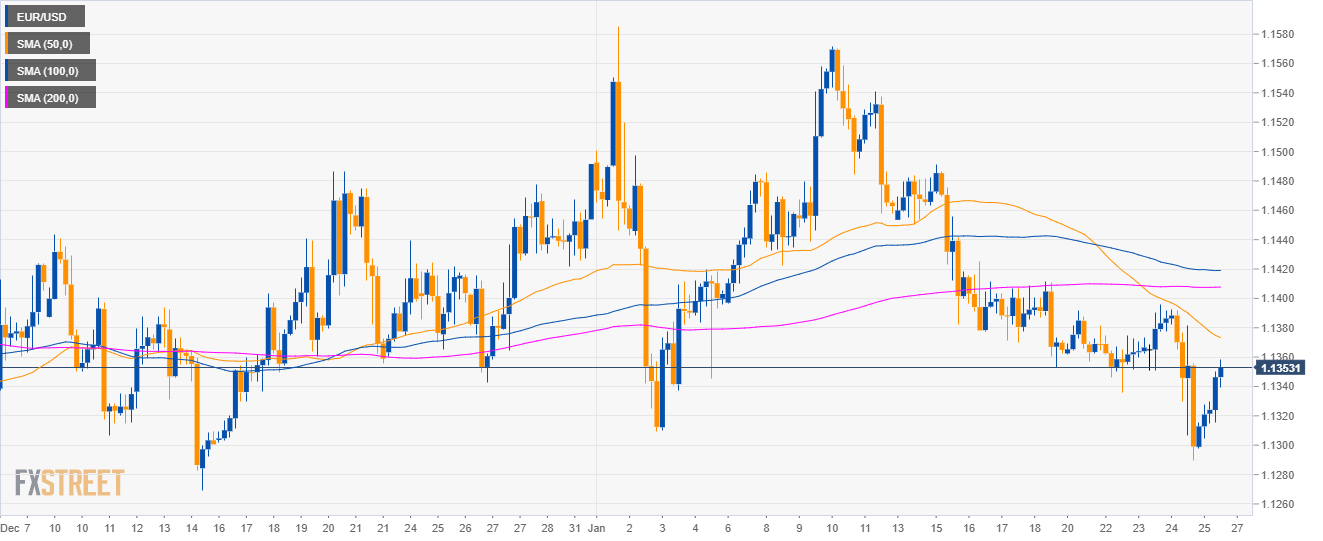
EUR/USD 4-hour chart
- Bears tested the 1.1300 support but were not able to continue the bear leg below this level.
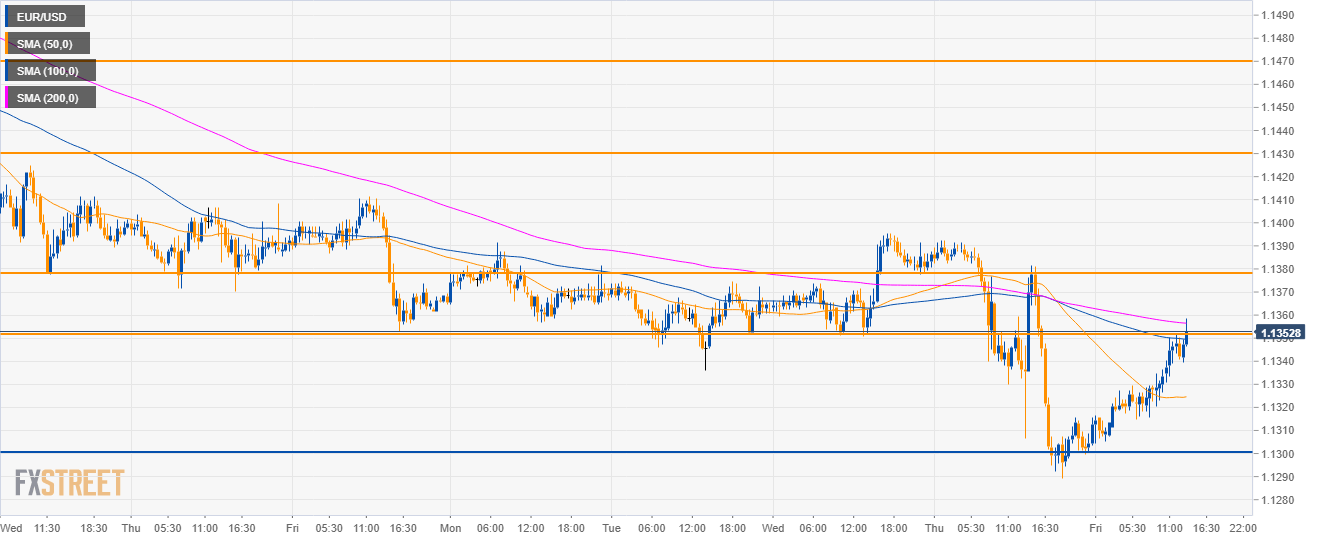
EUR/USD 30-minute chart
- EUR/USD is testing the 1.1350 level along with the 200 SMA.
- Bears had an opportunity to break below the 1.1300 but they were met with bullish interest. The sellers might try to reconquer the 1.1300 level again, but it is unlikely that the bear rallies will go very far.
- To the upside 1.1380, 1.1430 and 1.1470 targets remain on the cards for bulls.
Additional key levels
EUR/USD
Overview:
Today Last Price: 1.1355
Today Daily change: 47 pips
Today Daily change %: 0.42%
Today Daily Open: 1.1308
Trends:
Daily SMA20: 1.142
Daily SMA50: 1.139
Daily SMA100: 1.1452
Daily SMA200: 1.1584
Levels:
Previous Daily High: 1.1393
Previous Daily Low: 1.1289
Previous Weekly High: 1.1491
Previous Weekly Low: 1.1353
Previous Monthly High: 1.1486
Previous Monthly Low: 1.1269
Daily Fibonacci 38.2%: 1.1329
Daily Fibonacci 61.8%: 1.1353
Daily Pivot Point S1: 1.1267
Daily Pivot Point S2: 1.1227
Daily Pivot Point S3: 1.1164
Daily Pivot Point R1: 1.1371
Daily Pivot Point R2: 1.1433
Daily Pivot Point R3: 1.1474
