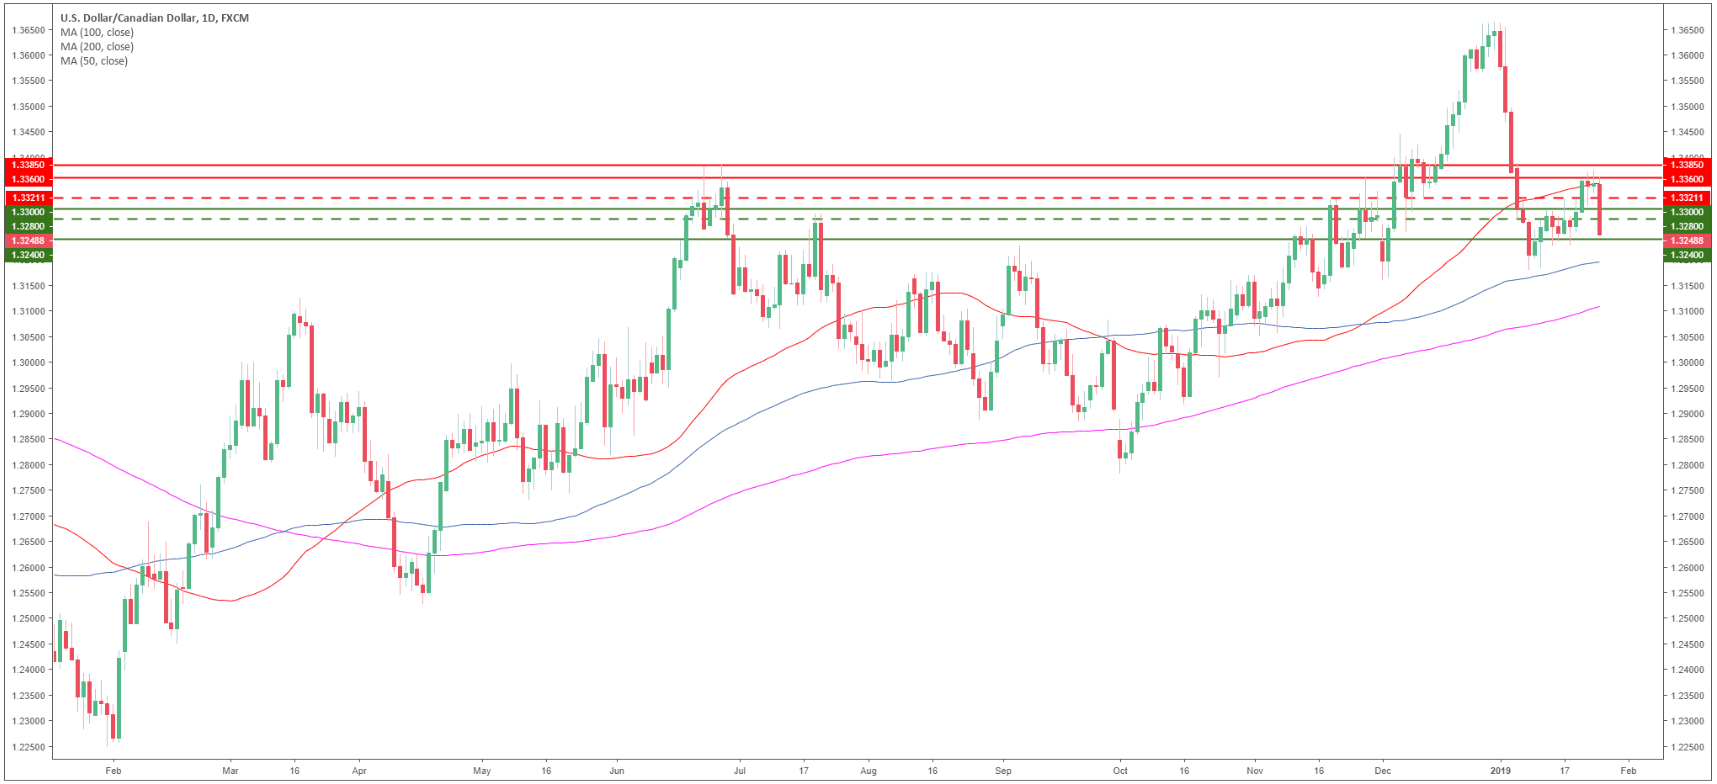
USD/CAD daily chart
- USD/CAD is currently having a pullback down below the 50-day simple moving average.
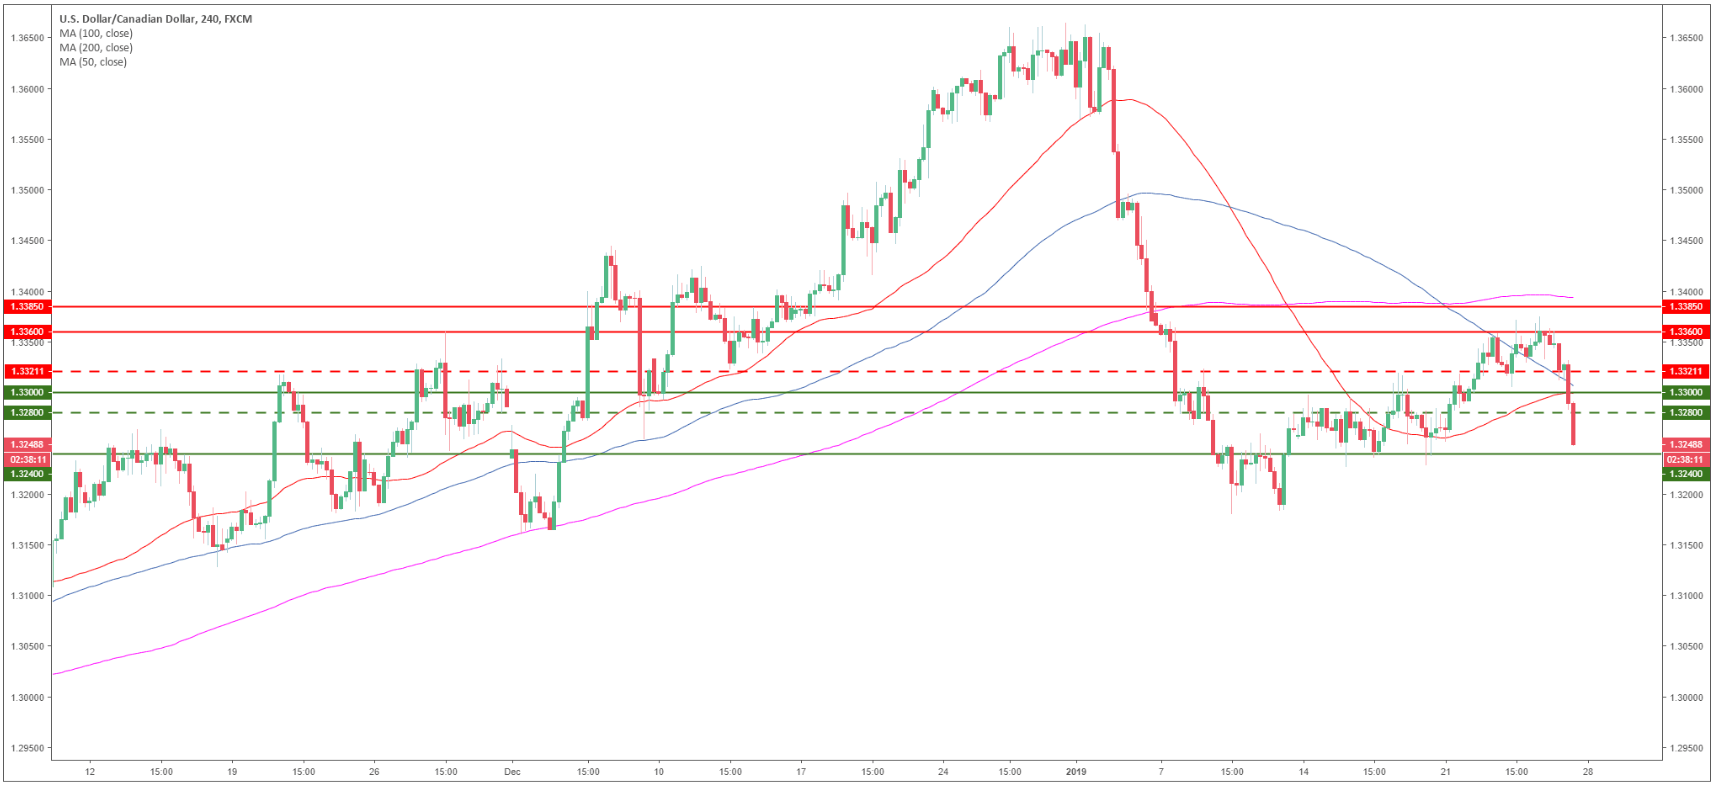
USD/CAD 4-hour chart
- USD/CAD broke below its main SMAs suggesting bearish momentum in the medium-term.
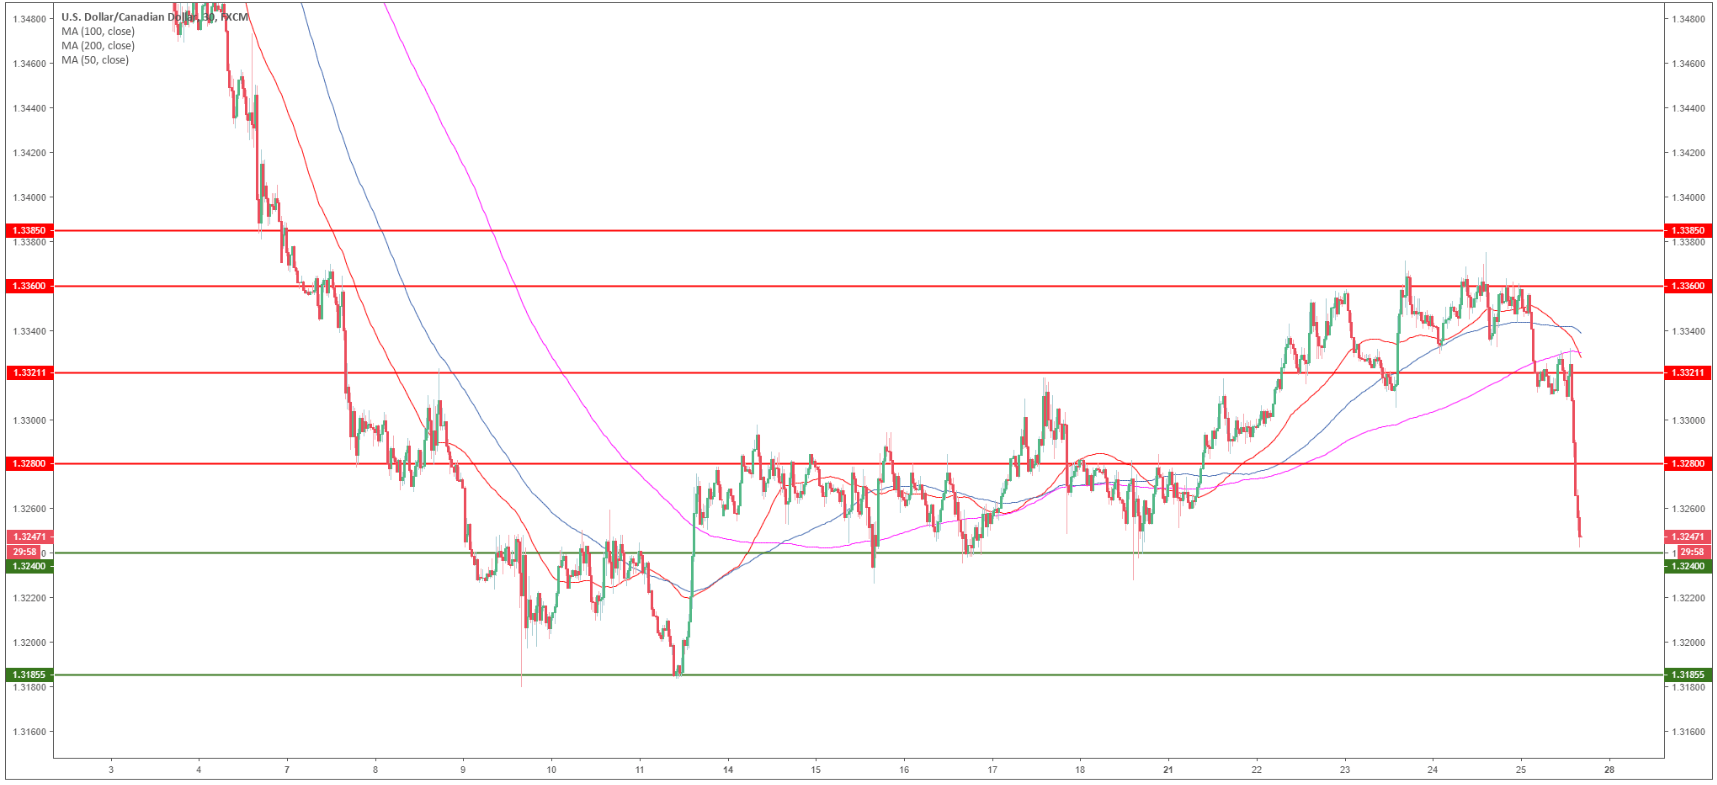
USD/CAD 30-minute chart
- Greenback bulls capitulated as the market is collapsing more than a 100 pips this Friday.
- The momentum is bearish and support is seen at 1.3240 and 1.3185.
- Resistance is seen at the 1.3280 level.
Additional key levels
USD/CAD
Overview:
Today Last Price: 1.3248
Today Daily change: -107 pips
Today Daily change %: -0.80%
Today Daily Open: 1.3355
Trends:
Daily SMA20: 1.3371
Daily SMA50: 1.3378
Daily SMA100: 1.3211
Daily SMA200: 1.3116
Levels:
Previous Daily High: 1.3378
Previous Daily Low: 1.3305
Previous Weekly High: 1.332
Previous Weekly Low: 1.3226
Previous Monthly High: 1.4134
Previous Monthly Low: 1.316
Daily Fibonacci 38.2%: 1.335
Daily Fibonacci 61.8%: 1.3333
Daily Pivot Point S1: 1.3315
Daily Pivot Point S2: 1.3274
Daily Pivot Point S3: 1.3243
Daily Pivot Point R1: 1.3387
Daily Pivot Point R2: 1.3418
Daily Pivot Point R3: 1.3459
