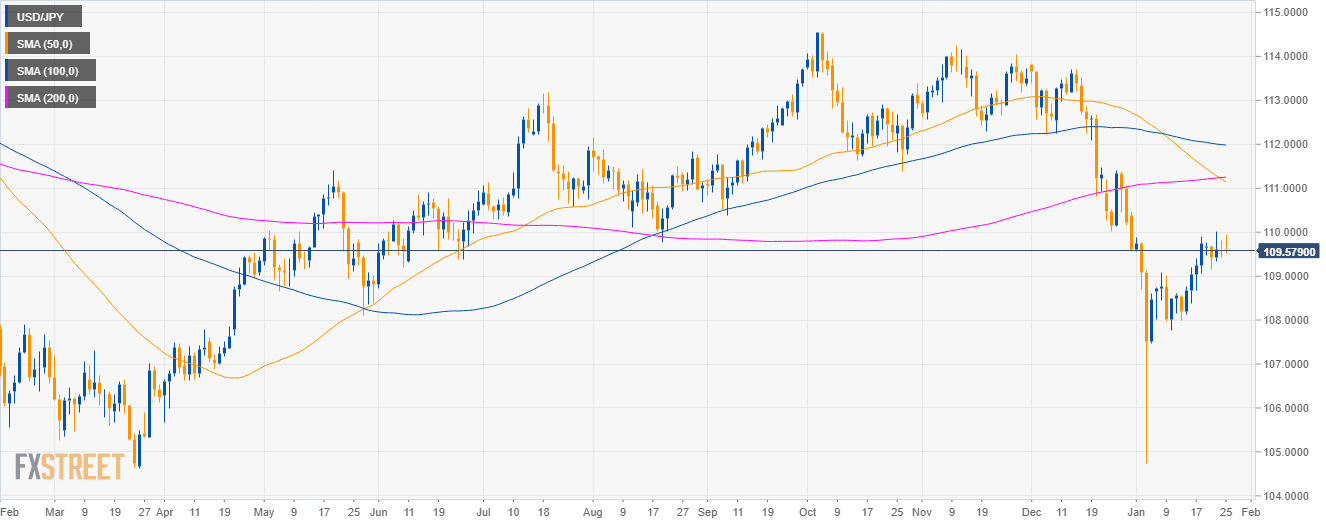
USD/JPY daily chart
- USD/JPY is trading in a deep pullback below the 50, 100 and 200-day simple moving averages (SMAs).
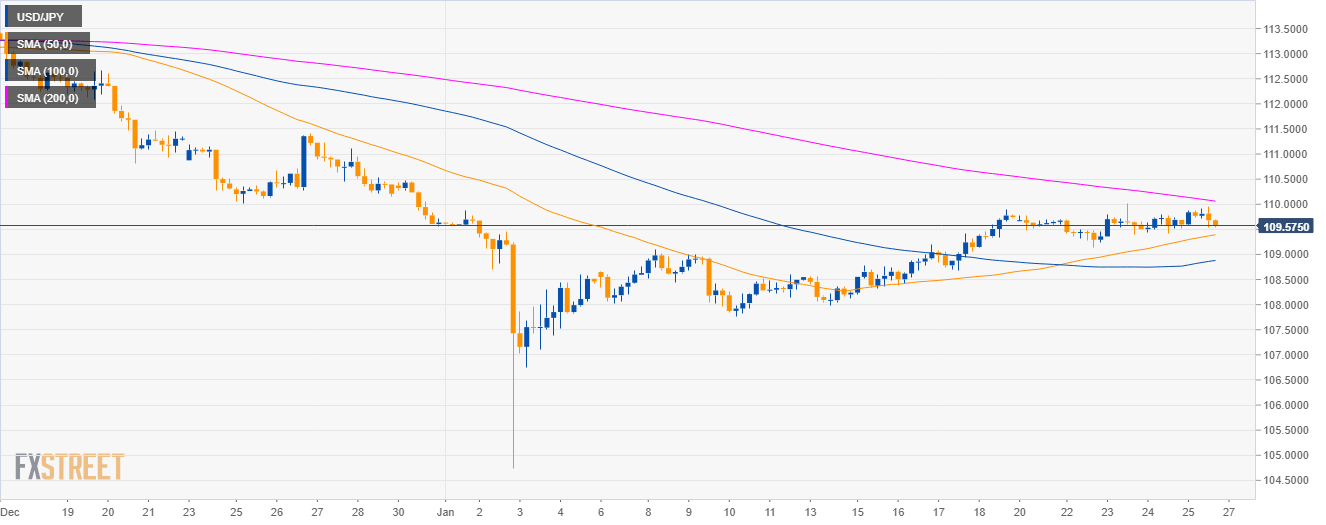
USD/JPY daily chart
- USD/JPY is trading below the 200 SMA.
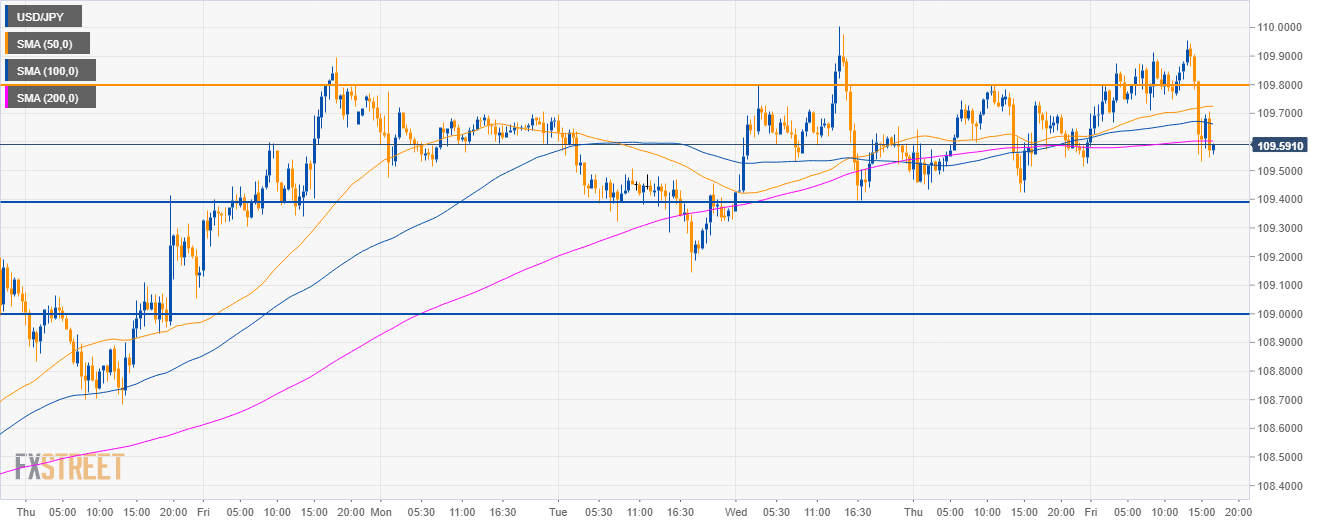
USD/JPY 30-minute chart
- USD/JPY has been trading the all week in a tight range.
- USD/JPY bulls might be running out of steam and a break below 109.40 would likely lead to a drop to the 109.00 figure.
Additional key levels
USD/JPY
Overview:
Today Last Price: 109.57
Today Daily change: -4 pips
Today Daily change %: -0.04%
Today Daily Open: 109.61
Trends:
Daily SMA20: 109.02
Daily SMA50: 111.21
Daily SMA100: 112
Daily SMA200: 111.24
Levels:
Previous Daily High: 109.8
Previous Daily Low: 109.42
Previous Weekly High: 109.9
Previous Weekly Low: 107.99
Previous Monthly High: 113.83
Previous Monthly Low: 109.55
Daily Fibonacci 38.2%: 109.57
Daily Fibonacci 61.8%: 109.66
Daily Pivot Point S1: 109.42
Daily Pivot Point S2: 109.23
Daily Pivot Point S3: 109.04
Daily Pivot Point R1: 109.8
Daily Pivot Point R2: 109.99
Daily Pivot Point R3: 110.18
