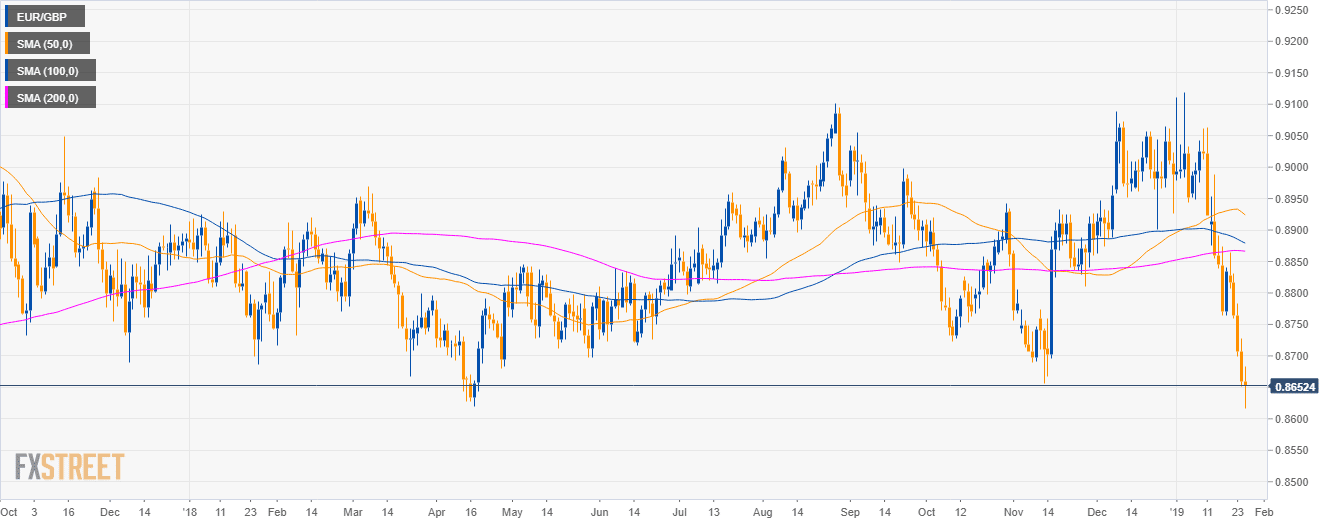
EUR/GBP daily chart
- EUR/GBP is trading in a sideways trend below the 50, 100 and 200-day simple moving averages (SMAs).
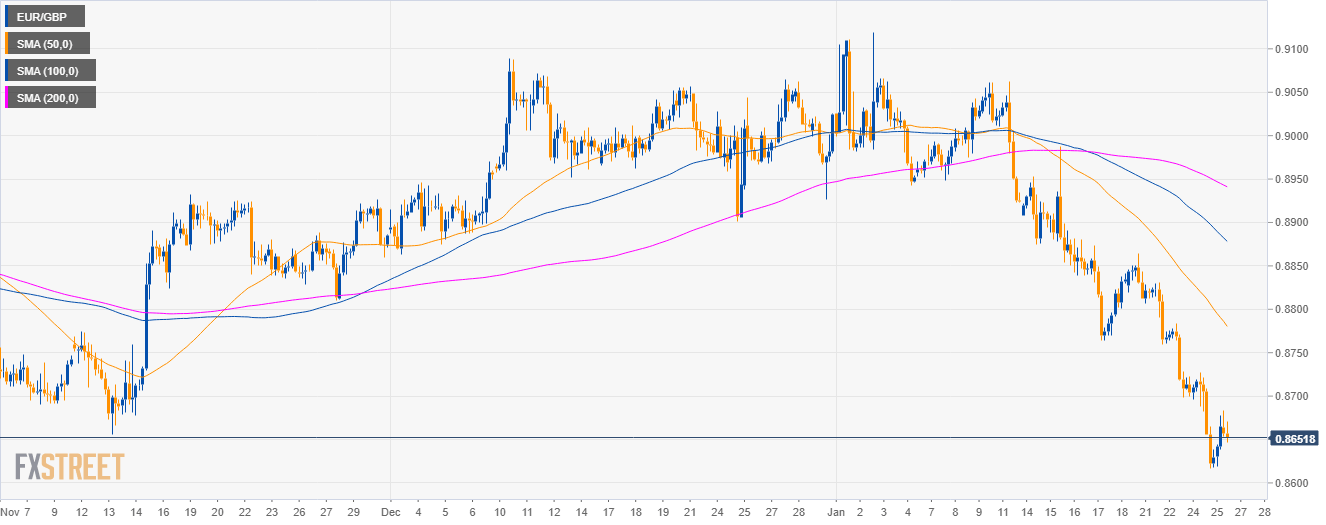
EUR/GBP 4-hour chart
- EUR/GBP is trading below the main SMAs as the market printed new 2019 lows.
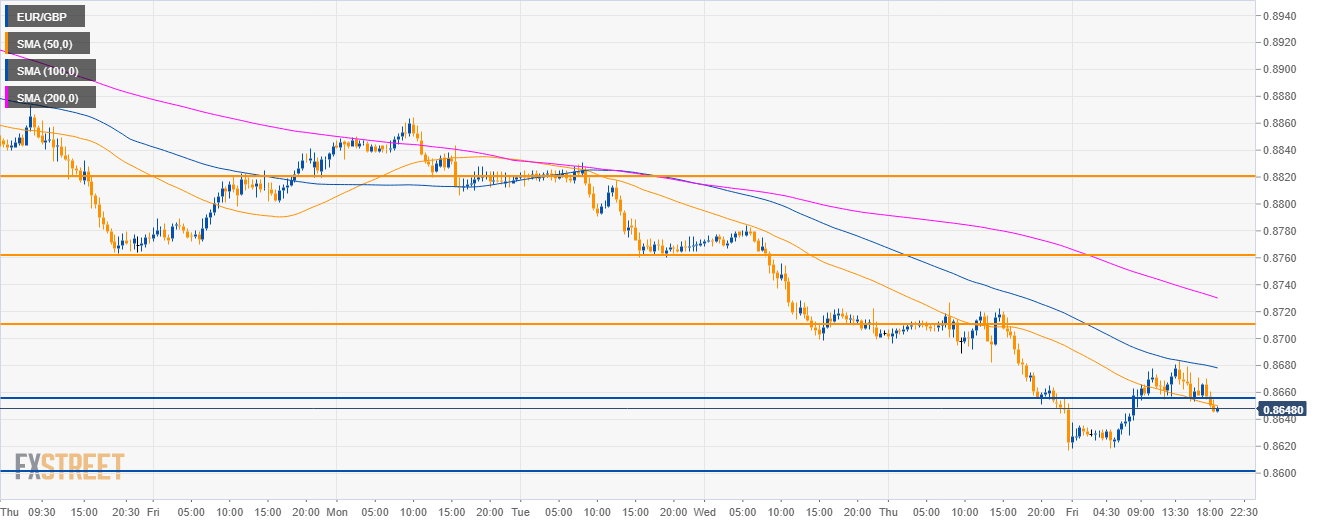
EUR/GBP 30-minute chart
- EUR/GBP is trading below 0.8650 support and its main SMAs suggesting bearish momentum.
- Support is seen at 0.8600 figure while resistance is at 0.8710 and the 0.8760 level.
Additional key levels
EUR/GBP
Overview:
Today Last Price: 0.8646
Today Daily change: -14 pips
Today Daily change %: -0.16%
Today Daily Open: 0.866
Trends:
Daily SMA20: 0.8904
Daily SMA50: 0.8929
Daily SMA100: 0.8882
Daily SMA200: 0.8867
Levels:
Previous Daily High: 0.8727
Previous Daily Low: 0.8651
Previous Weekly High: 0.8988
Previous Weekly Low: 0.8764
Previous Monthly High: 0.9089
Previous Monthly Low: 0.8863
Daily Fibonacci 38.2%: 0.868
Daily Fibonacci 61.8%: 0.8698
Daily Pivot Point S1: 0.8631
Daily Pivot Point S2: 0.8603
Daily Pivot Point S3: 0.8555
Daily Pivot Point R1: 0.8707
Daily Pivot Point R2: 0.8755
Daily Pivot Point R3: 0.8783
