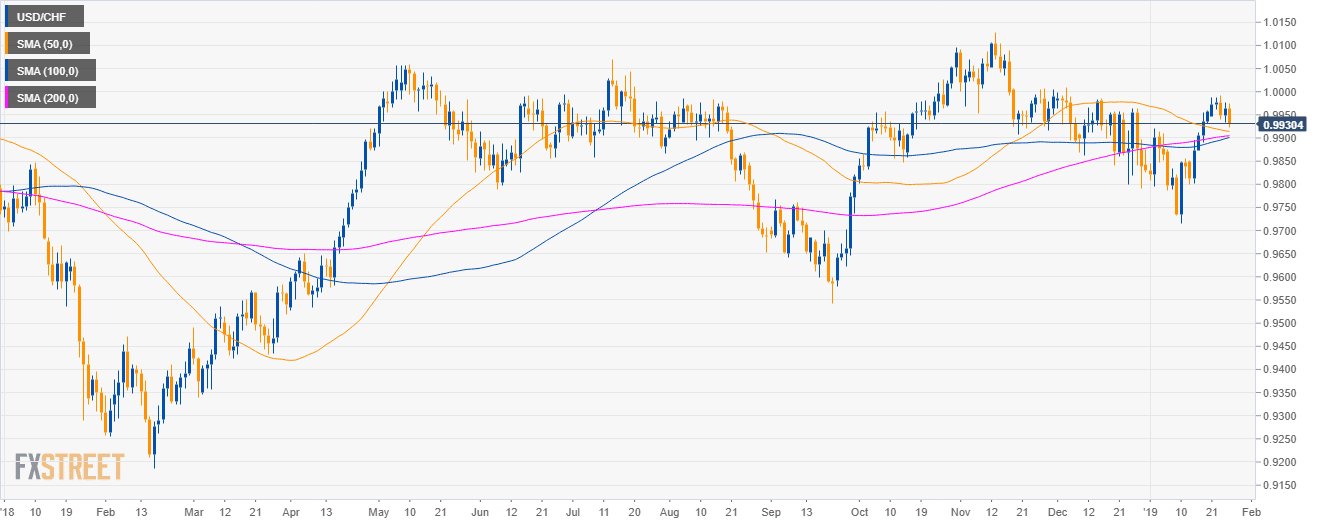
USD/CHF daily chart
- USD/CHF is trading in a sideways trend above the 50, 100 and 200-day simple moving averages (SMAs).
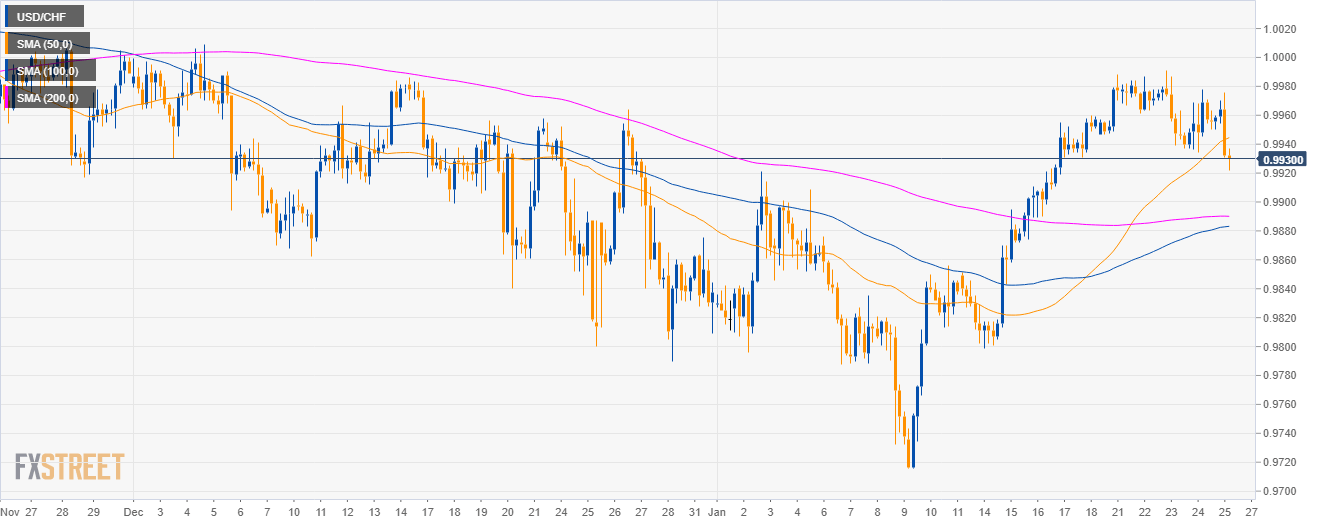
USD/CHF 4-hour chart
- Bears broke the 50 SMA to the downside.
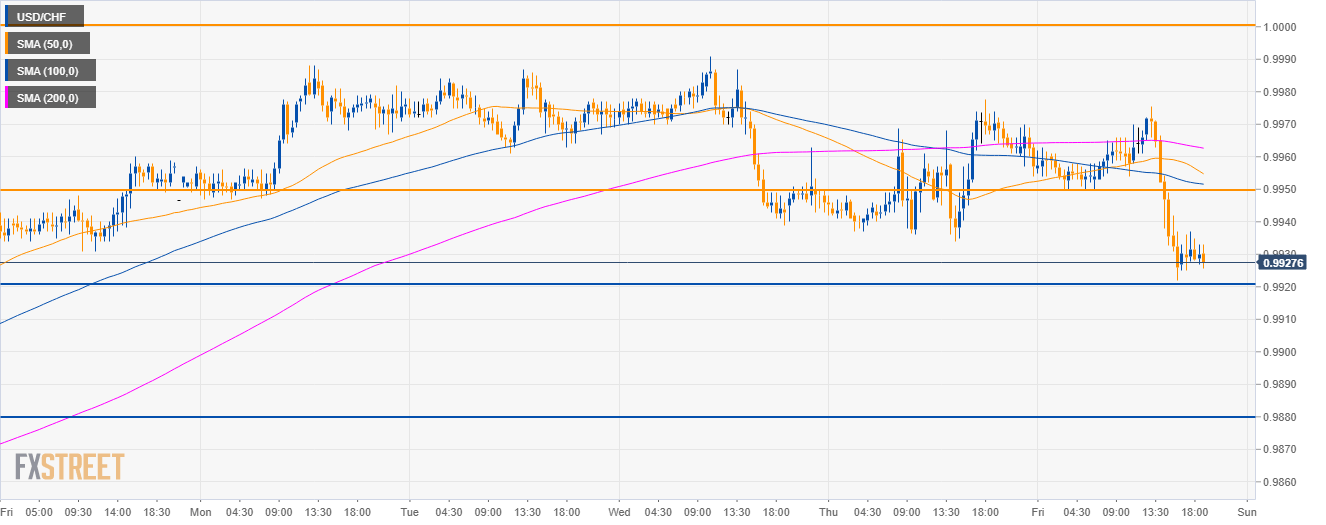
USD/CHF 30-minute chart
- USD/CHF broke below the 0.9950 level and found support at the 0.9920 level.
- A break below the 0.9920 would open the doors to the 0.9880 target.
Additional key levels
USD/CHF
Overview:
Today Last Price: 0.9932
Today Daily change: -32 pips
Today Daily change %: -0.32%
Today Daily Open: 0.9964
Trends:
Daily SMA20: 0.9875
Daily SMA50: 0.9915
Daily SMA100: 0.9899
Daily SMA200: 0.9903
Levels:
Previous Daily High: 0.9978
Previous Daily Low: 0.9934
Previous Weekly High: 0.996
Previous Weekly Low: 0.9799
Previous Monthly High: 1.0009
Previous Monthly Low: 0.979
Daily Fibonacci 38.2%: 0.9961
Daily Fibonacci 61.8%: 0.9951
Daily Pivot Point S1: 0.9939
Daily Pivot Point S2: 0.9915
Daily Pivot Point S3: 0.9896
Daily Pivot Point R1: 0.9983
Daily Pivot Point R2: 1.0002
Daily Pivot Point R3: 1.0026
