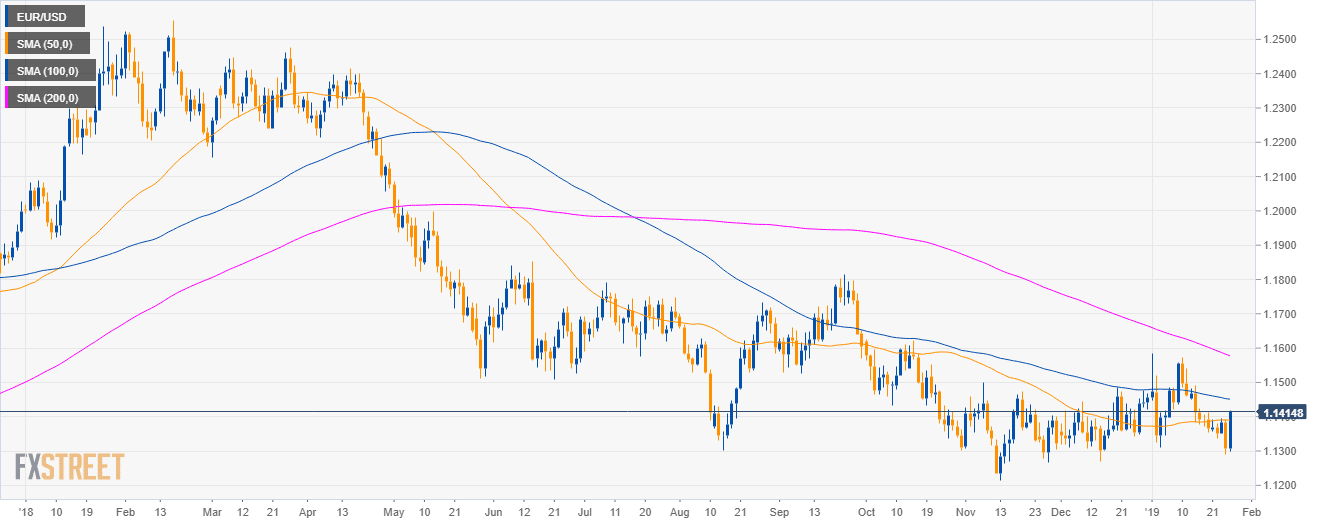
EUR/USD daily chart
- EUR/USD is trading in a bear trend below the 100 and 200-day simple moving averages (SMAs).
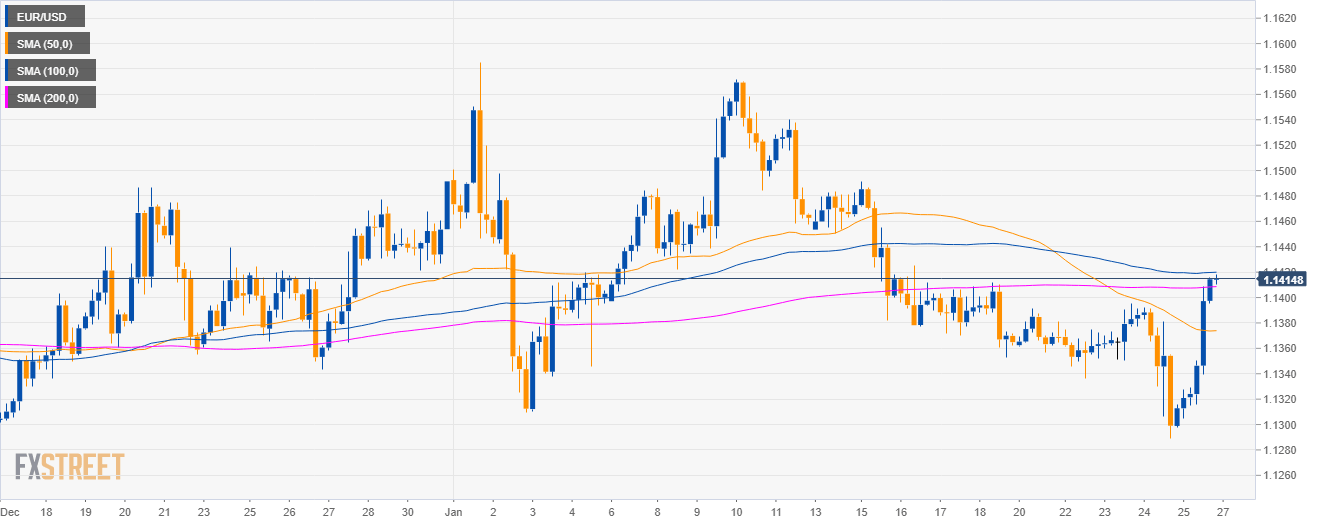
EUR/USD 4-hour chart
- EUR/USD had the best daily advance since early July sending the market above the 1.1400 figure and the 50 and 200 SMA.
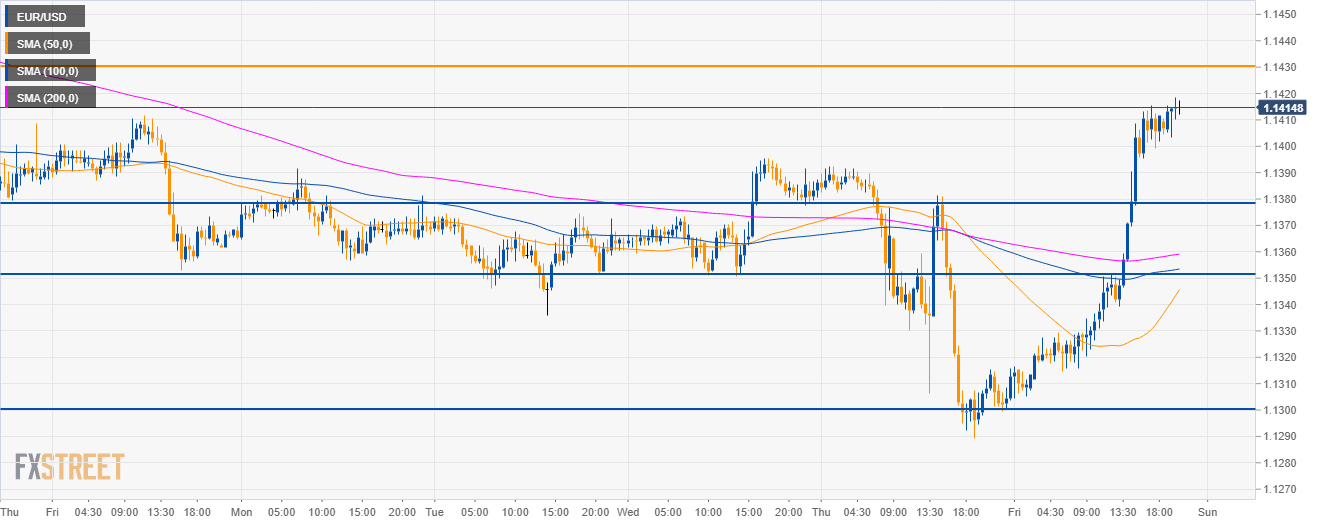
EUR/USD 30-minute chart
- EUR/USD broke above its main SMAs suggesting bullish momentum.
- To the upside, the 1.1430 and 1.1470 targets remain firmly in place.
- To the downside, investors can expect support near 1.1380 and 1.1350 level.
Additional key levels
EUR/USD
Overview:
Today Last Price: 1.1415
Today Daily change: 107 pips
Today Daily change %: 0.95%
Today Daily Open: 1.1308
Trends:
Daily SMA20: 1.142
Daily SMA50: 1.139
Daily SMA100: 1.1452
Daily SMA200: 1.1584
Levels:
Previous Daily High: 1.1393
Previous Daily Low: 1.1289
Previous Weekly High: 1.1491
Previous Weekly Low: 1.1353
Previous Monthly High: 1.1486
Previous Monthly Low: 1.1269
Daily Fibonacci 38.2%: 1.1329
Daily Fibonacci 61.8%: 1.1353
Daily Pivot Point S1: 1.1267
Daily Pivot Point S2: 1.1227
Daily Pivot Point S3: 1.1164
Daily Pivot Point R1: 1.1371
Daily Pivot Point R2: 1.1433
Daily Pivot Point R3: 1.1474
