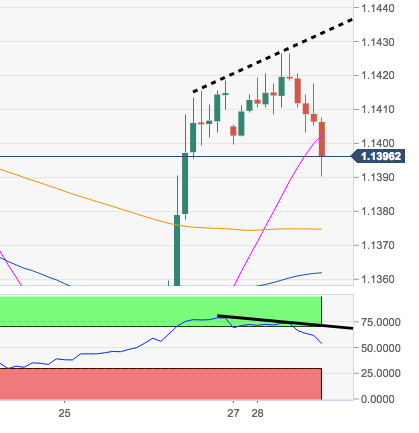
- The pair gathered further traction on Friday and moved above the critical 1.1400 the figure, where it appears to have met some important resistance so far today.
- The bearish divergence in the hourly RSI (14) hints at the likeliness that a correction lower could be in the offing in the short-term horizon.
- Further upside, in the meantime, should regain the 1.1440/50 band, where converge a Fibo retracement of the September-November dop and the key 100-day SMA.
EUR/USD daily chart
EUR/USD
Overview:
Today Last Price: 1.1393
Today Daily change: -0.0022 pips
Today Daily change %: -0.19%
Today Daily Open: 1.1415
Trends:
Daily SMA20: 1.1418
Daily SMA50: 1.139
Daily SMA100: 1.1451
Daily SMA200: 1.1579
Levels:
Previous Daily High: 1.1418
Previous Daily Low: 1.13
Previous Weekly High: 1.1418
Previous Weekly Low: 1.1289
Previous Monthly High: 1.1486
Previous Monthly Low: 1.1269
Daily Fibonacci 38.2%: 1.1373
Daily Fibonacci 61.8%: 1.1345
Daily Pivot Point S1: 1.1337
Daily Pivot Point S2: 1.1259
Daily Pivot Point S3: 1.1218
Daily Pivot Point R1: 1.1456
Daily Pivot Point R2: 1.1497
Daily Pivot Point R3: 1.1575
