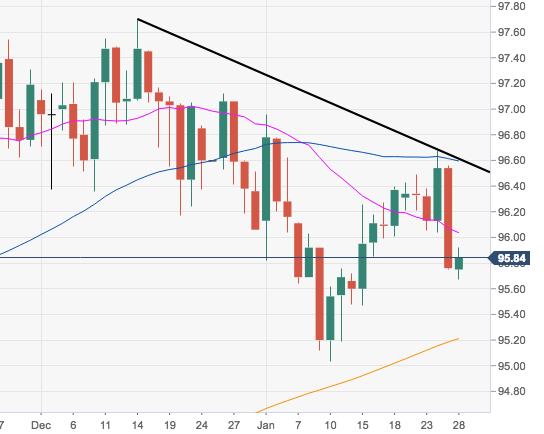
- The index broke below the critical support at 96.00 the figure and dropped further to fresh lows in the 95.70/65 band, where it seems to have met some decent support for the time being.
- The bearish view in DXY remains well and sound as long as the short-term resistance line, today at 96.61, caps the upside. The 55-day SMA, today at 96.55, reinforces this area of resistance.
- Extra downside should meet support at the 200-day SMA at 95.22 ahead of YTD lows near the 95.00 handle.
DXY daily chart
Dollar Index Spot
Overview:
Today Last Price: 95.84
Today Daily change: 0.08 pips
Today Daily change %: 0.08%
Today Daily Open: 95.76
Trends:
Daily SMA20: 96.05
Daily SMA50: 96.56
Daily SMA100: 96.12
Daily SMA200: 95.18
Levels:
Previous Daily High: 96.56
Previous Daily Low: 95.75
Previous Weekly High: 96.68
Previous Weekly Low: 95.75
Previous Monthly High: 97.71
Previous Monthly Low: 96.06
Daily Fibonacci 38.2%: 96.06
Daily Fibonacci 61.8%: 96.25
Daily Pivot Point S1: 95.49
Daily Pivot Point S2: 95.21
Daily Pivot Point S3: 94.68
Daily Pivot Point R1: 96.3
Daily Pivot Point R2: 96.83
Daily Pivot Point R3: 97.11
