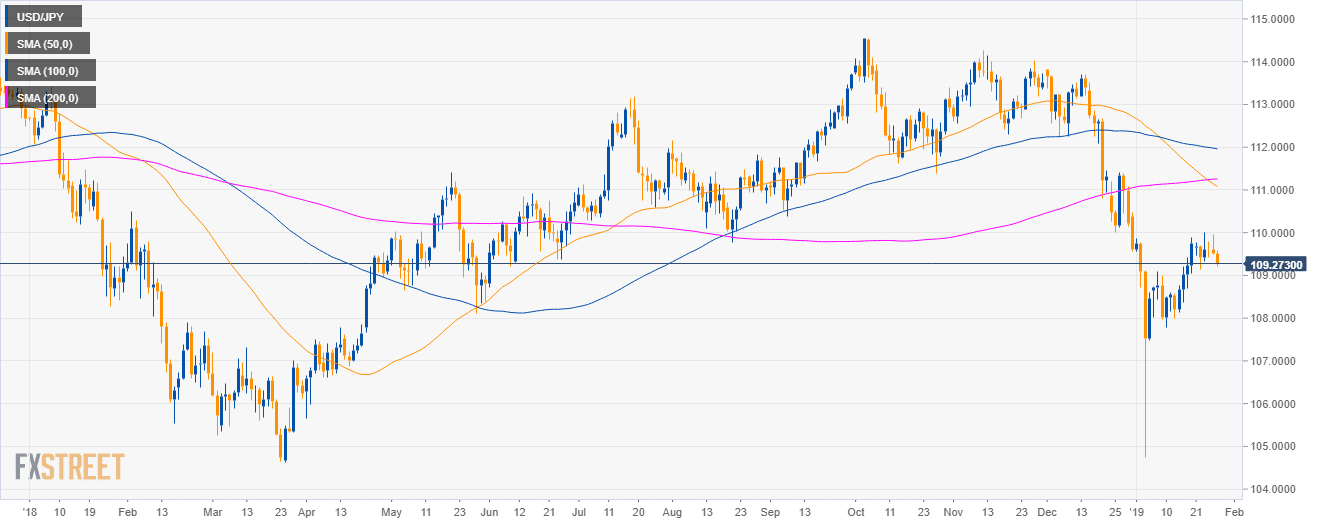
USD/JPY daily chart
- USD/JPY is having a deep pullback below the 50, 100 and 200-day simple moving averages (SMAs).
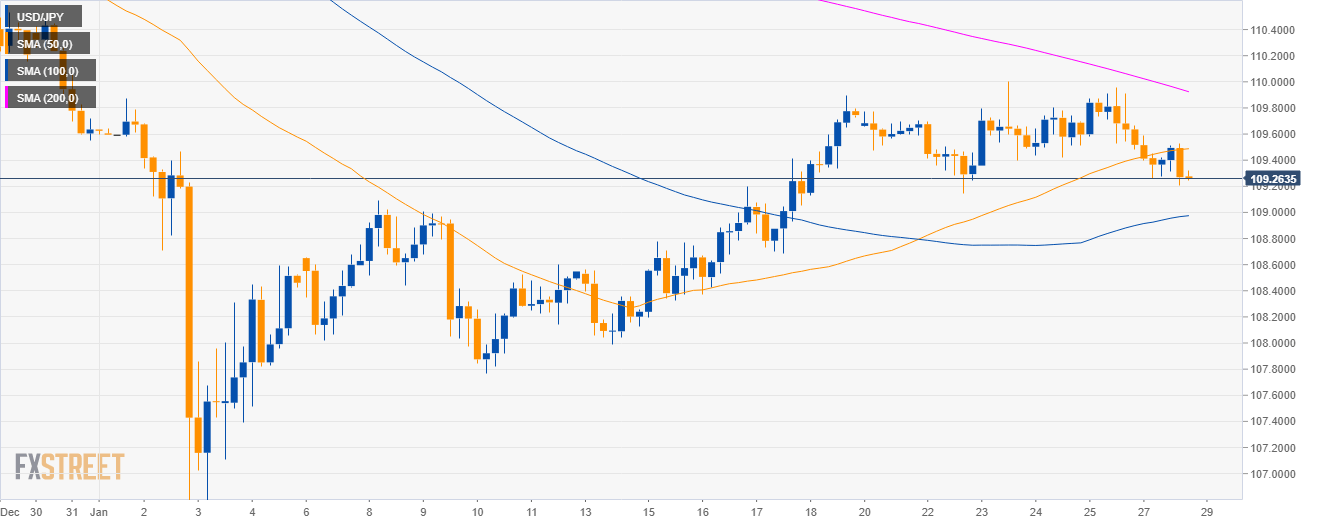
USD/JPY 4-hour chart
- USD/JPY is trading below the 50 and 200 SMAs suggesting somewhat bearish momentum in the medium-term.
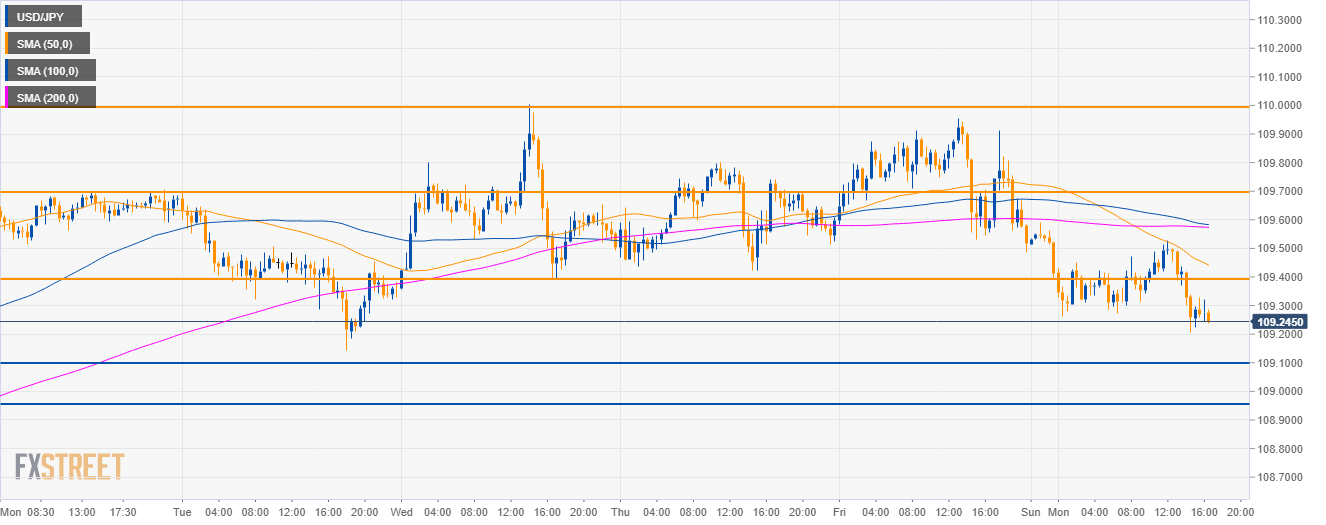
USD/JPY 30-minute chart
- USD/JPY broke below the 109.40 level and is trading below its main SMAs suggesting bearish momentum in the near-term.
- If the bears keep going the next levels to watch become 109.10 and 108.95 to the downside.
- Resistance is seen at 109.70 and the 110.00 level.
Additional key levels
USD/JPY
Overview:
Today Last Price: 109.28
Today Daily change: -24 pips
Today Daily change %: -0.22%
Today Daily Open: 109.52
Trends:
Daily SMA20: 108.98
Daily SMA50: 111.14
Daily SMA100: 111.98
Daily SMA200: 111.25
Levels:
Previous Daily High: 109.95
Previous Daily Low: 109.48
Previous Weekly High: 110
Previous Weekly Low: 109.14
Previous Monthly High: 113.83
Previous Monthly Low: 109.55
Daily Fibonacci 38.2%: 109.66
Daily Fibonacci 61.8%: 109.77
Daily Pivot Point S1: 109.35
Daily Pivot Point S2: 109.18
Daily Pivot Point S3: 108.88
Daily Pivot Point R1: 109.82
Daily Pivot Point R2: 110.12
Daily Pivot Point R3: 110.29
