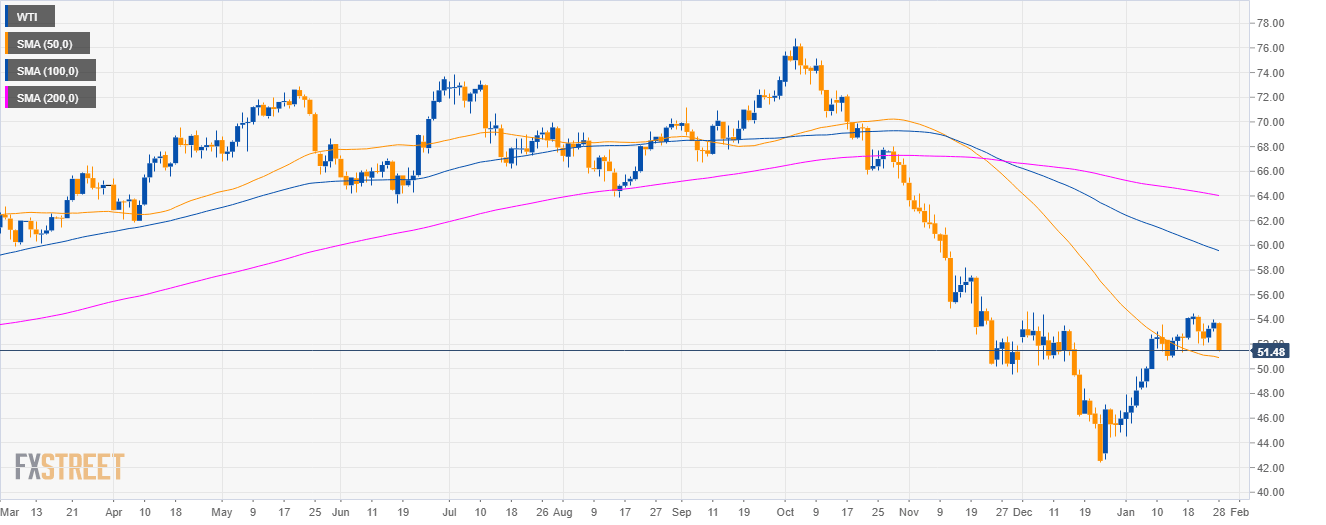
Oil daily chart
- Crude oil WTI is trading in a bear trend below the 100 and 200-day simple moving averages (SMAs).
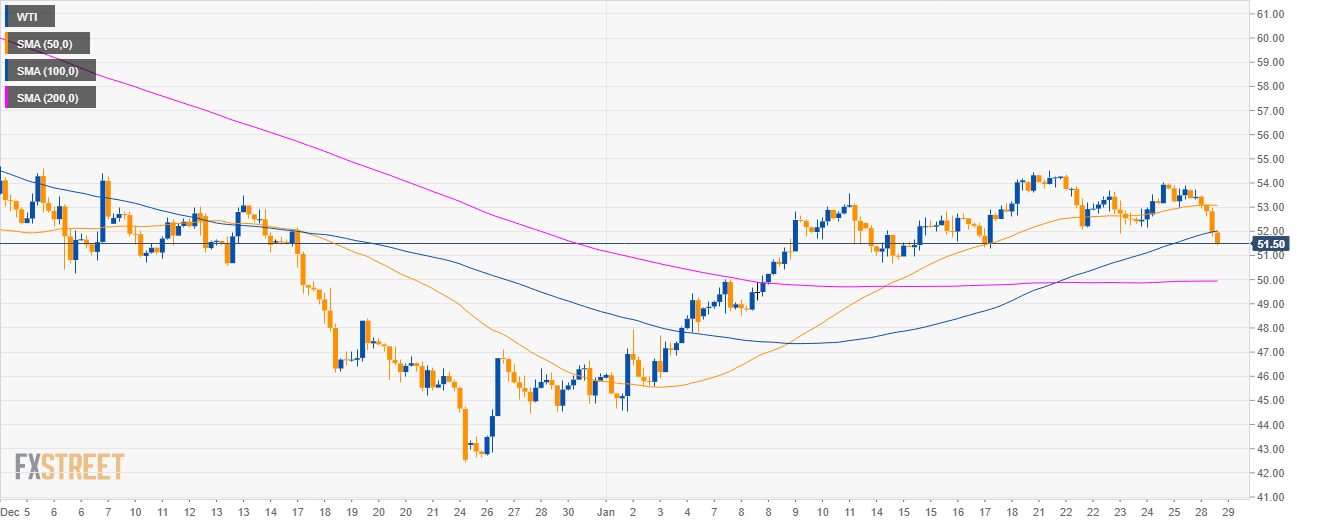
Oil 4-hour chart
- WTI broke below the 52.00 figure along with the 50 and 100 SMA suggesting bearish momentum in the medium-term.
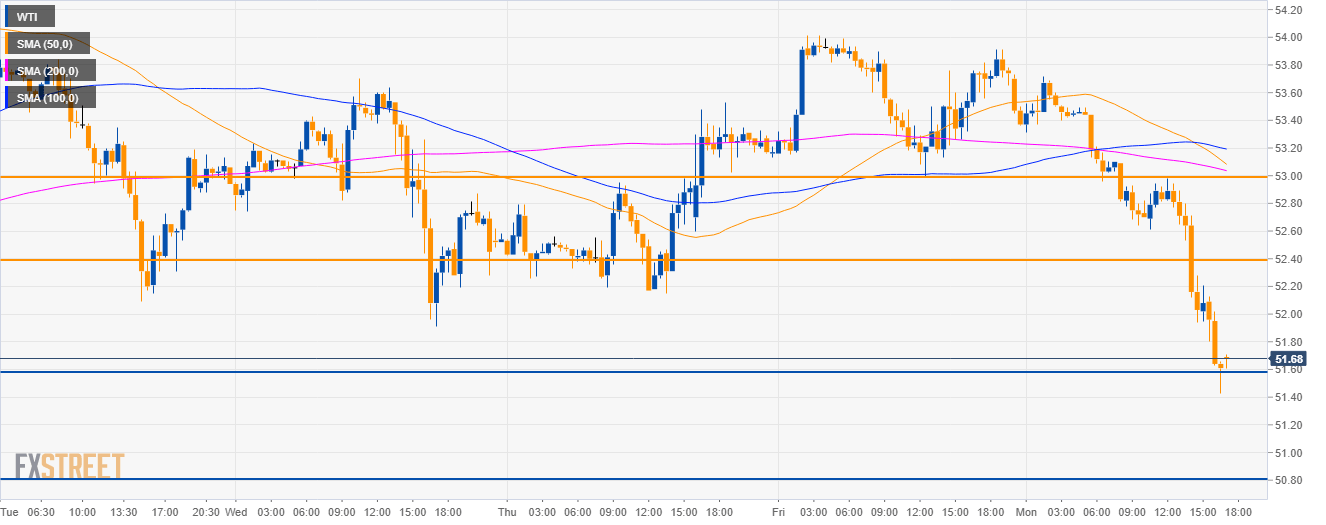
Oil 30-minute chart
- Oil bears broke the 52.40 support as they are trading below the main SMAs.
- If sellers can break below 51.60, WTI can drop towards the 50.80 level.
- Resistance to the upside is seen near 52.40 and 53.00 figure.
Additional key levels
WTI
Overview:
Today Last Price: 51.67
Today Daily change: -207 points
Today Daily change %: -3.85%
Today Daily Open: 53.74
Trends:
Daily SMA20: 51.24
Daily SMA50: 50.63
Daily SMA100: 58.85
Daily SMA200: 63.75
Levels:
Previous Daily High: 54.01
Previous Daily Low: 52.99
Previous Weekly High: 54.51
Previous Weekly Low: 51.91
Previous Monthly High: 54.68
Previous Monthly Low: 42.45
Daily Fibonacci 38.2%: 53.62
Daily Fibonacci 61.8%: 53.38
Daily Pivot Point S1: 53.15
Daily Pivot Point S2: 52.56
Daily Pivot Point S3: 52.13
Daily Pivot Point R1: 54.17
Daily Pivot Point R2: 54.6
Daily Pivot Point R3: 55.19
