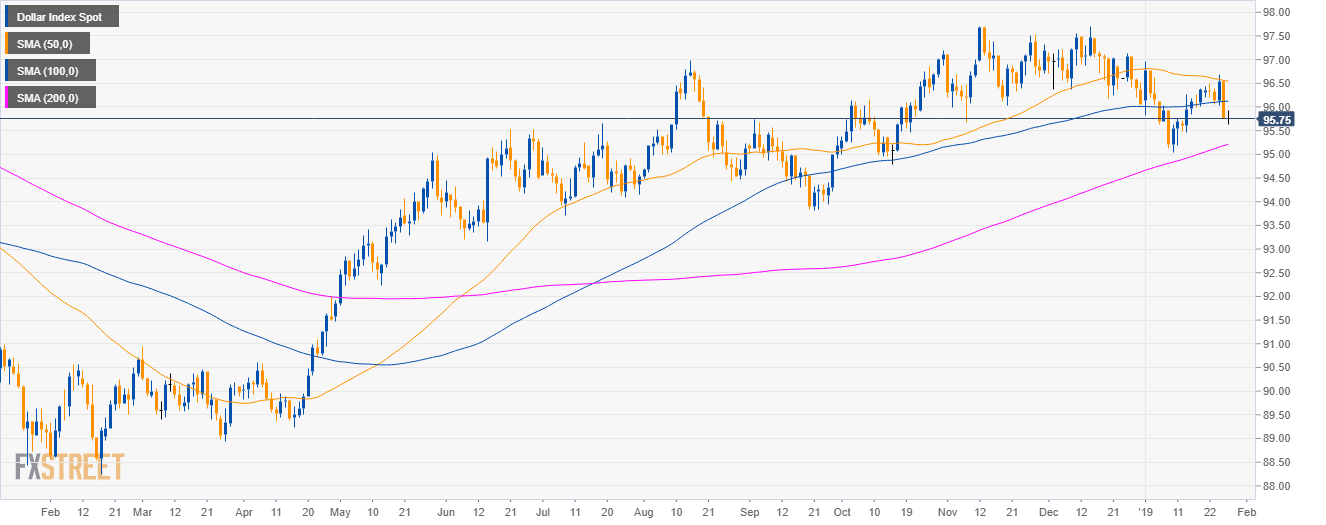
DXY daily chart
- The US Dollar Index (DXY) is in a bull trend above 200-day simple moving average (SMA).
- However, bears are trading below the 50 and 100 SMAs.
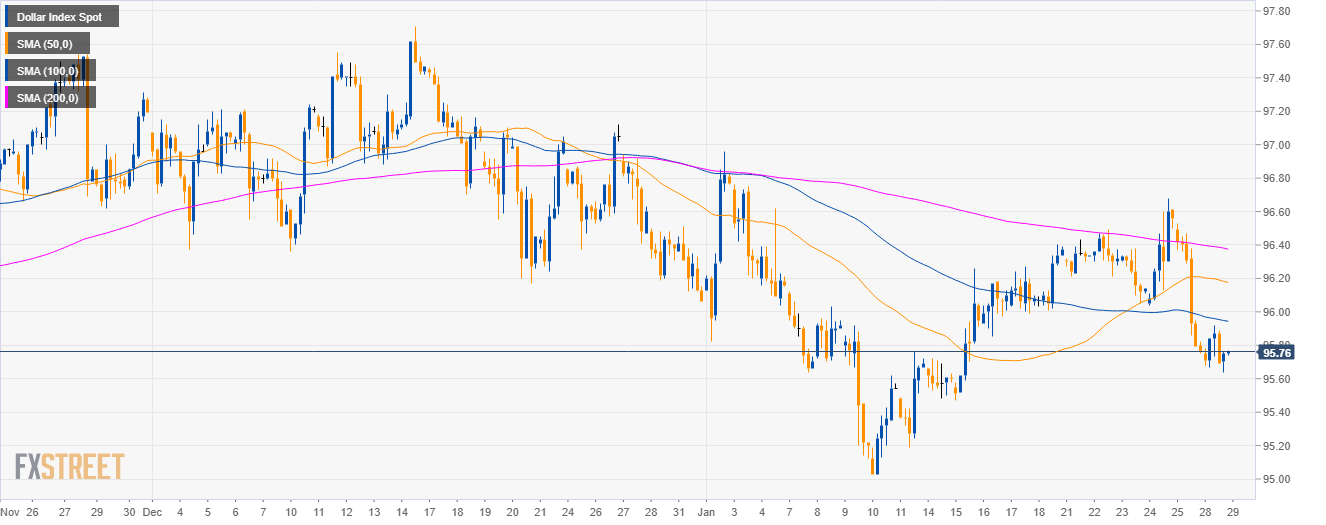
DXY 4-hour chart
- DXY is trading below the main SMAs, suggesting bearish momentum in the medium-term.
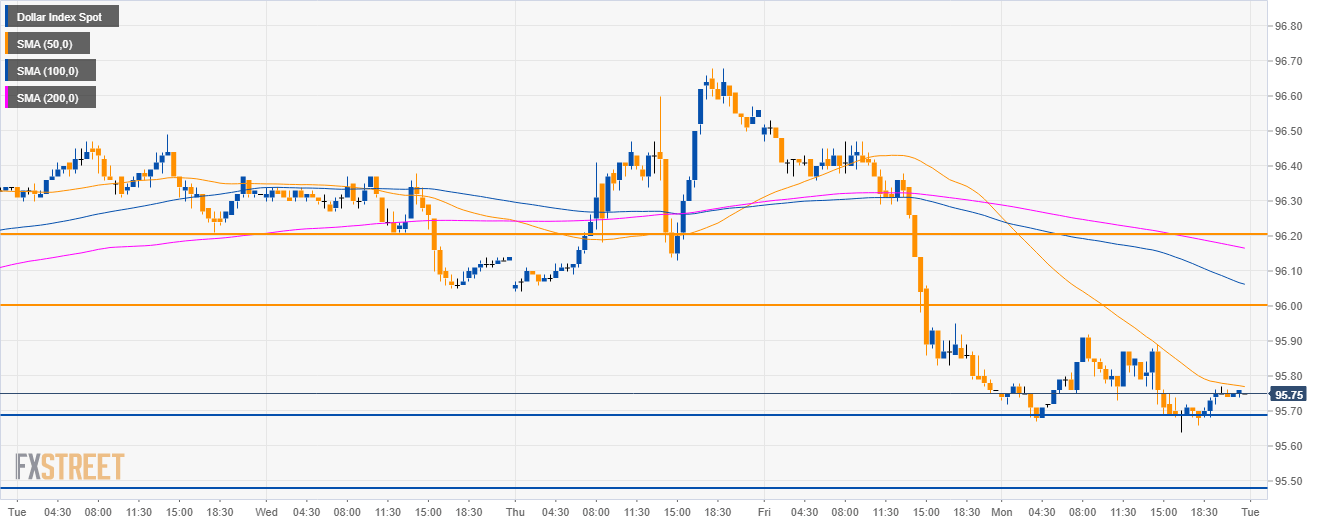
DXY 30-minute chart
- DXY found some support at 95.70 suggesting a potential short-term rebound to 96.00 and 96.20 if the bulls gather enough steam.
- The next level of support to the downside is seen at 95.50.
Additional key level
Dollar Index Spot
Overview:
Today Last Price: 95.76
Today Daily change: 0.00 pips
Today Daily change %: 0.00%
Today Daily Open: 95.76
Trends:
Daily SMA20: 96.05
Daily SMA50: 96.56
Daily SMA100: 96.12
Daily SMA200: 95.18
Levels:
Previous Daily High: 96.56
Previous Daily Low: 95.75
Previous Weekly High: 96.68
Previous Weekly Low: 95.75
Previous Monthly High: 97.71
Previous Monthly Low: 96.06
Daily Fibonacci 38.2%: 96.06
Daily Fibonacci 61.8%: 96.25
Daily Pivot Point S1: 95.49
Daily Pivot Point S2: 95.21
Daily Pivot Point S3: 94.68
Daily Pivot Point R1: 96.3
Daily Pivot Point R2: 96.83
Daily Pivot Point R3: 97.11
